
GenDaB - the Gene DataBase
GenDaB is a one-stop-shop for human genes. The database includes a plethora of data and provides many search options. Genes can be specified by their gene symbol or NCBI ID but also indirectly, using their position, the phenotypes they may cause or their protein-protein interactions (to name a few options). The database can also be queried using an API which makes it easy to integrate information from GenDaB in your own applications (examples on the left.)GenDaB is free to use and it does not require any registration.
GenDaB Documentation
Query mask
The query mask is the main page and search interface of GenDaB. It offers a multitude of query options,
which are sorted into different sections and can be expanded and collapsed depending on your research
interests.
In addition to the following documentation on those sections, you may also refer to the help option on the
query mask itself.
To use this help, simply select the Display help checkbox above the first section.
This will activate pop-ups that will display additional information on an input element whenever the mouse
pointer is drawn over it.
General settings
At the top of the query mask, there are two basic settings: selecting the genome version for your
query (at present GRCh37 or GRCh38) and specifying whether the output is ordered by gene symbol or position.
Additionally there is the aforementioned Display help checkbox and a Reset this page option,
which will delete all your individual input and reset the query mask to default status.

Display options
As the name suggests, in this sections you can choose which data sources to display in the output. Carefully
selecting these options can help to keep the
size
of the output in check.
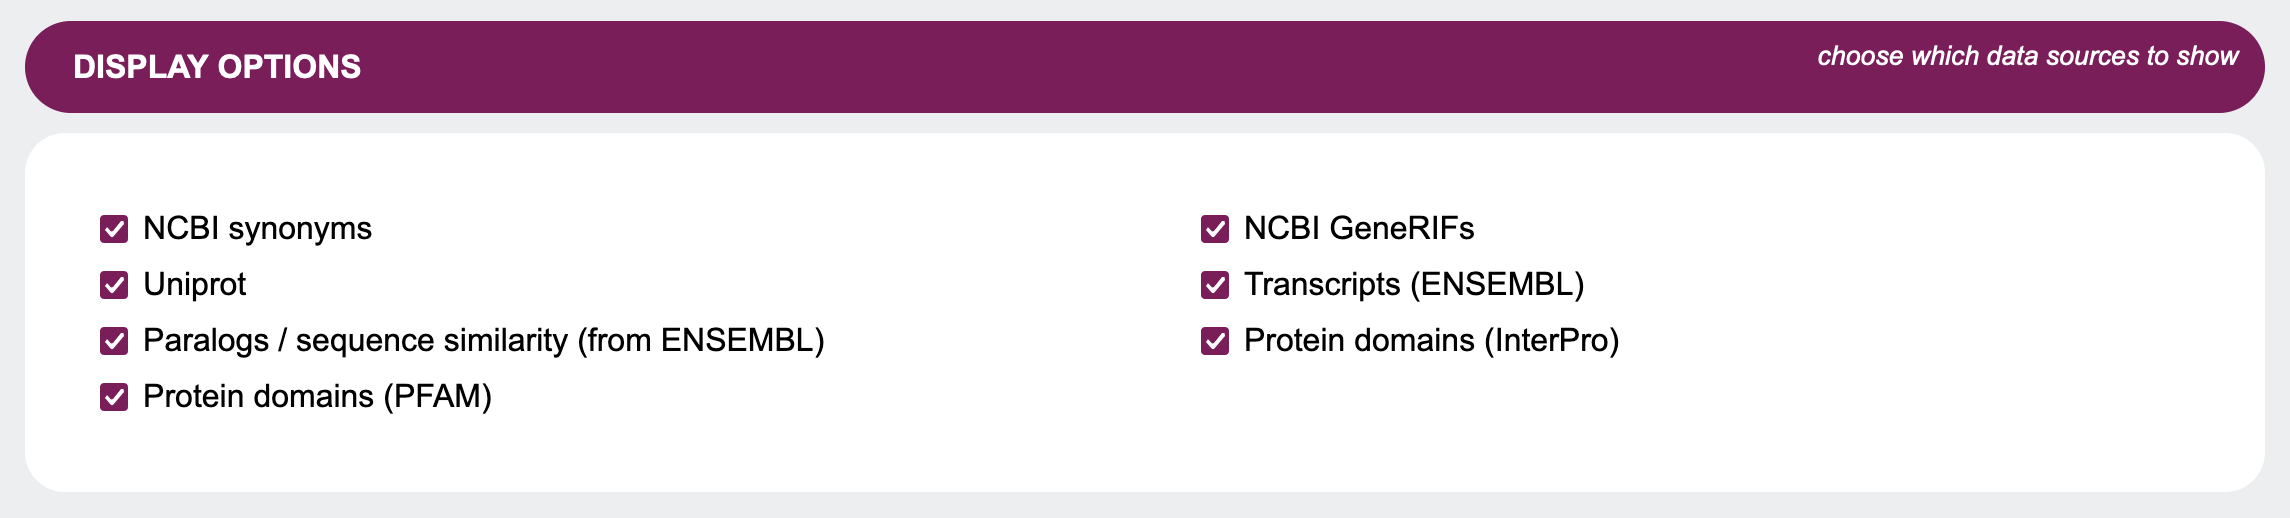 Note that these are not the only data sources GenDaB can display. For a list of all integrated data sources
see
Integrated data.
Note that these are not the only data sources GenDaB can display. For a list of all integrated data sources
see
Integrated data.
Additionally, there are radio buttons in other sections to hide, show or filter by other data sources in
their
respective sections.
 To hide, show or filter by these, select the respective radio button in the relevant areas
explained below.
To hide, show or filter by these, select the respective radio button in the relevant areas
explained below.
Set cookies
Above the Search button which will submit your query, you have the option to store your selection in the Display Options section in cookies, so that the query mask will remember your preferred settings when you return to it at a later time.
 Please note, that your setting will only be saved if you select this option and then submit your query with the Searchbutton. Checking this box without submitting your query will not save your selection.
Candidate genes, regions or panels
To query GenDaB, candidate genes must be defined. This can be done in several ways.
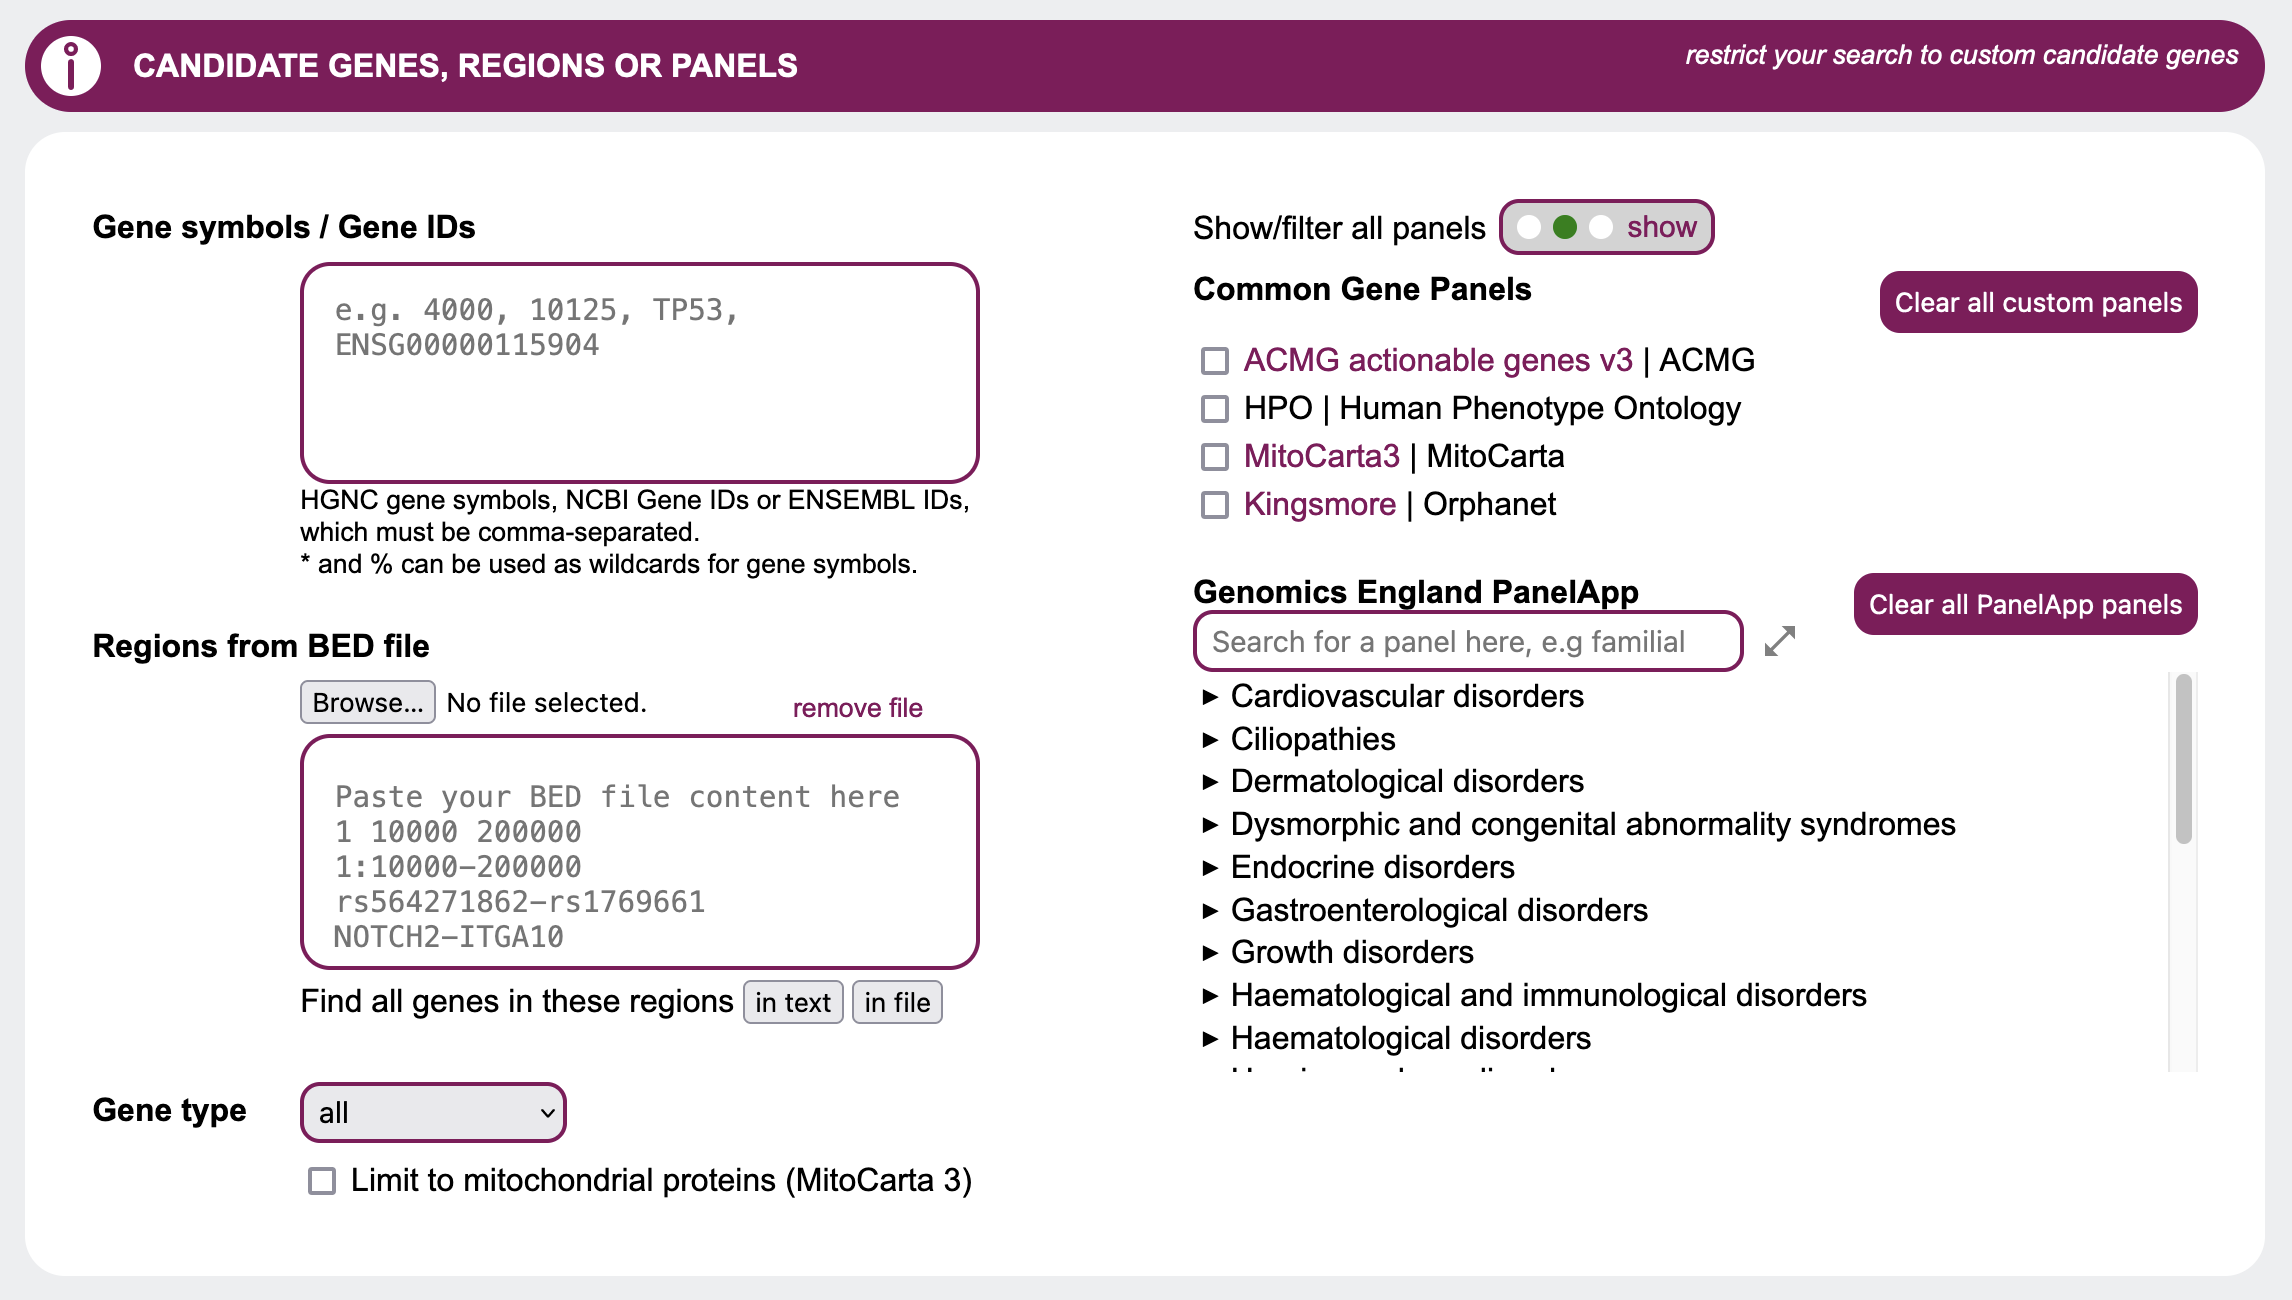
Single genes / gene lists
If you already have specific genes in mind, the simplest option is to directly specify genes to be treated as candidates. Simply insert a single or comma-separated list of HGNC gene symbols, Ensembl IDs or NCBI gene IDs.
Genomic regions
Another option is to specify genetic regions of interest in bed file format, SNP to SNP or gene to gene.Example:
1:10000-200000
rs564271862-rs1769661
NOTCH2-ITGA10
This can be done via manual input or by uploading a .bed file. Example: brca_example.bed
Gene Type
You may want to restrict the output to a specific gene type, which can easily be done by selecting it in the Gene type drop down. By default this option is set to all and does not restrict the output based on types of genes.
Mitochondrial proteins
You may restrict your search to genes with strong support of mitochondrial localisation as reported by MitoCarta 3 by selecting the checkbox Limit to mitochondrial proteins.
Panels
In this section you can choose which Common Gene Panels to display or filter by, by using the
corresponding radio button and selecting panels such as HPO and ACMG with their respective checkboxes.
For the Genomics England PanelApp, you can search for and select individual panels, which are sorted by
disease categories that can be expanded and collapsed.
To search for a specific panel by name, you may use the search field above the PanelApp list. Please note
that for the search to work, you must put in at least four letters of the panel you seek.
Phenotypes & Diseases
When searching for candidates genes, it is likely that you may want to look for genes causing specific
phenotypes. GenDaB offers multiple options to display and filter for known phenotypes based on several
ontologies such as the Human Phenotype Ontology (HPO) and OMIM.
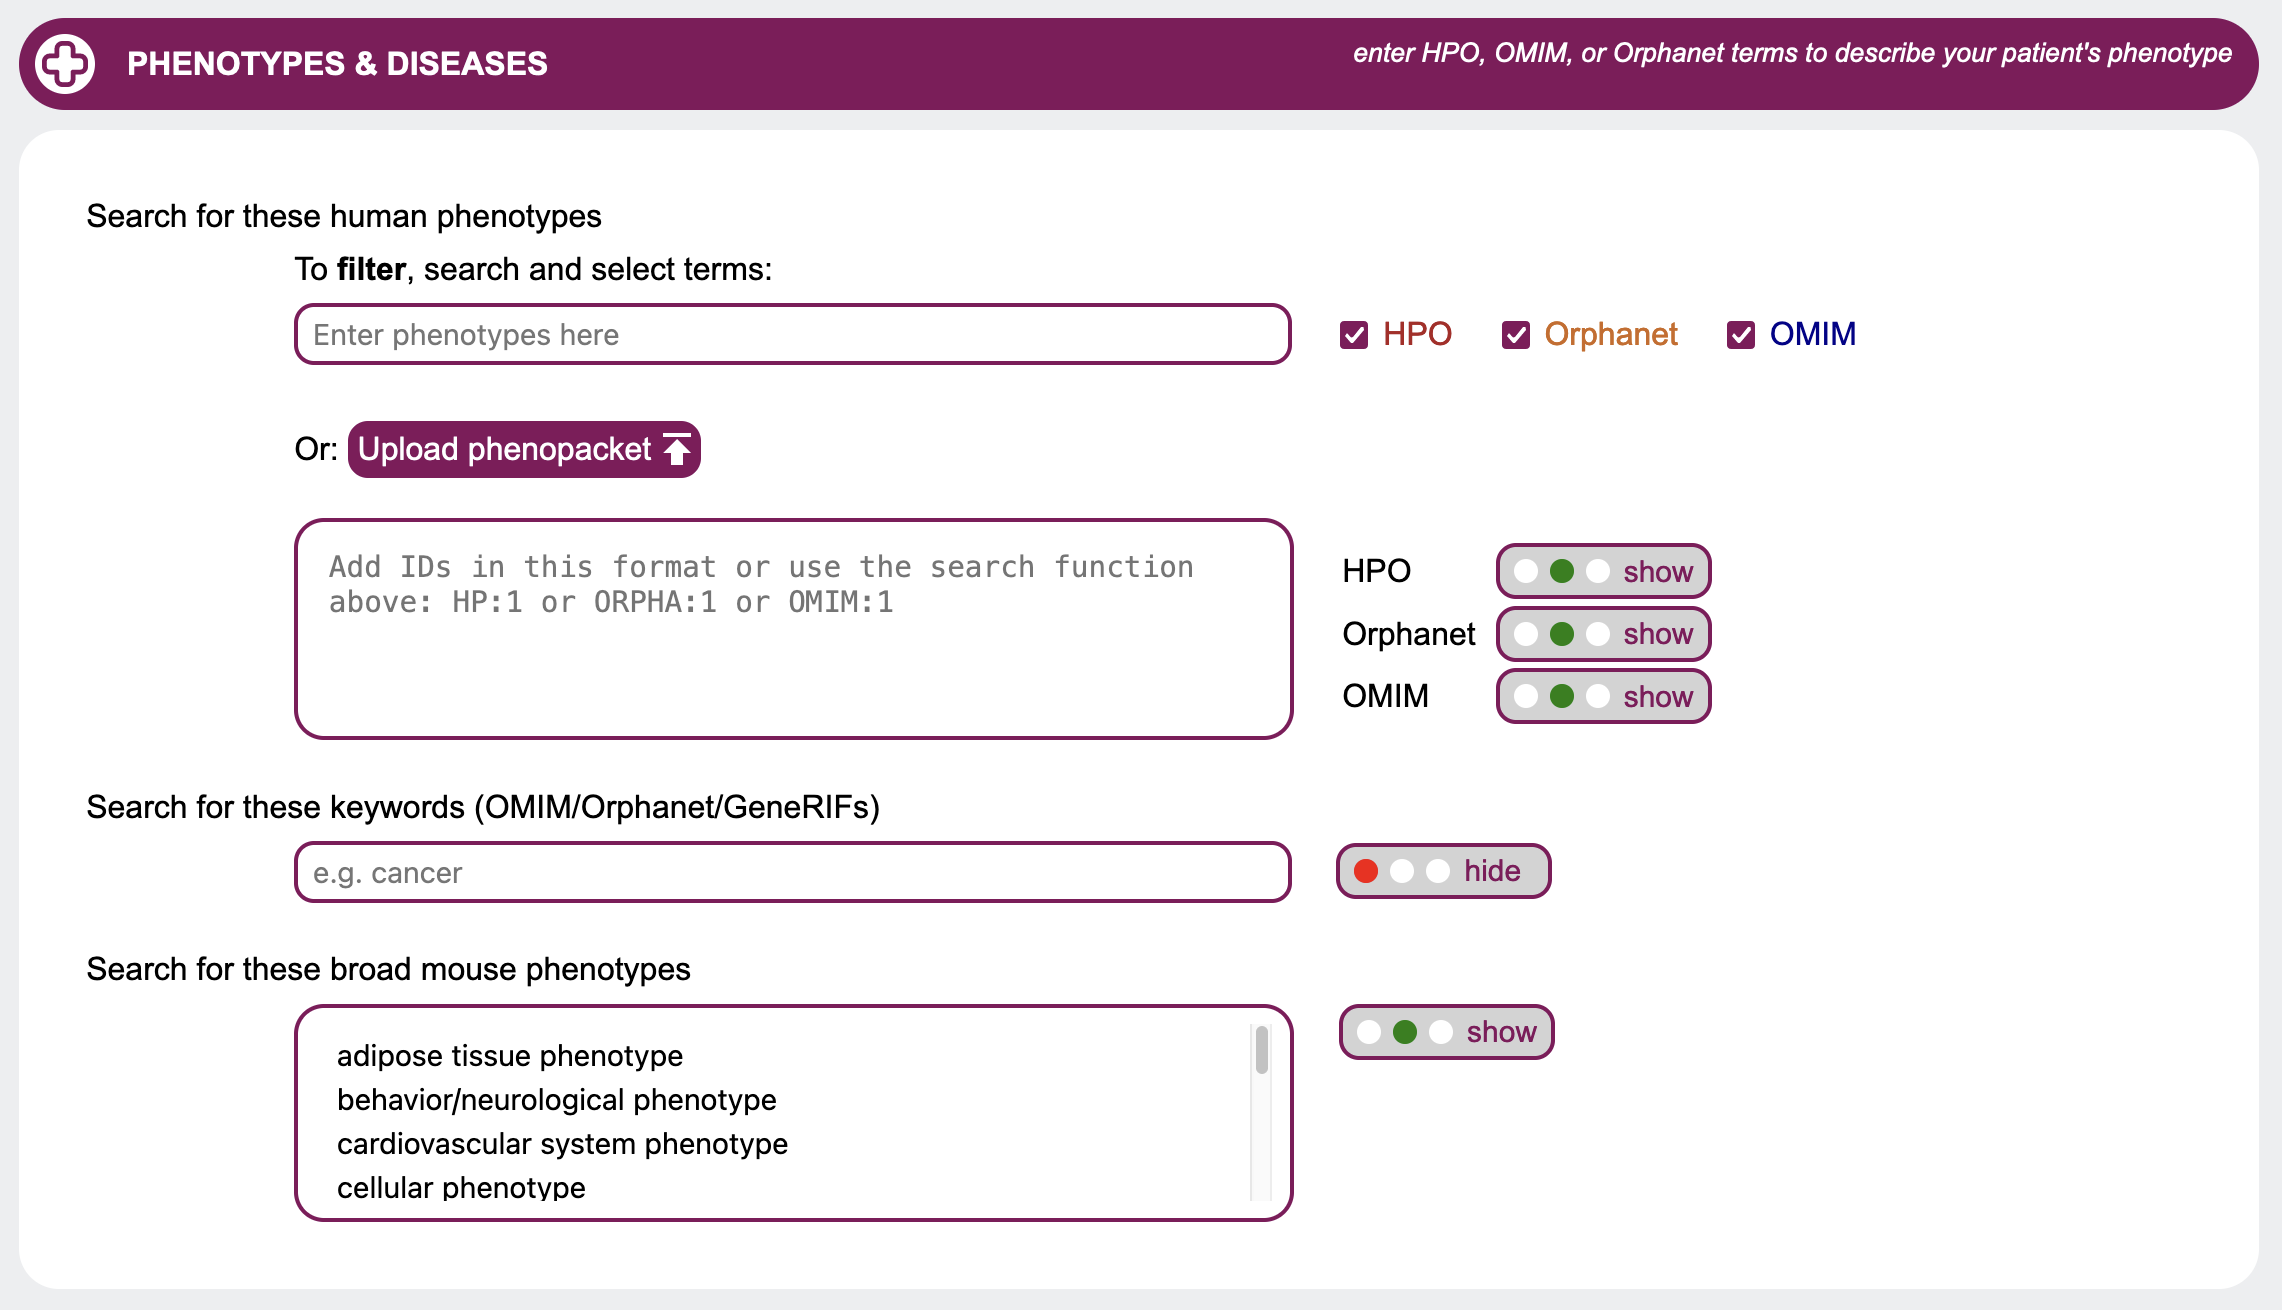
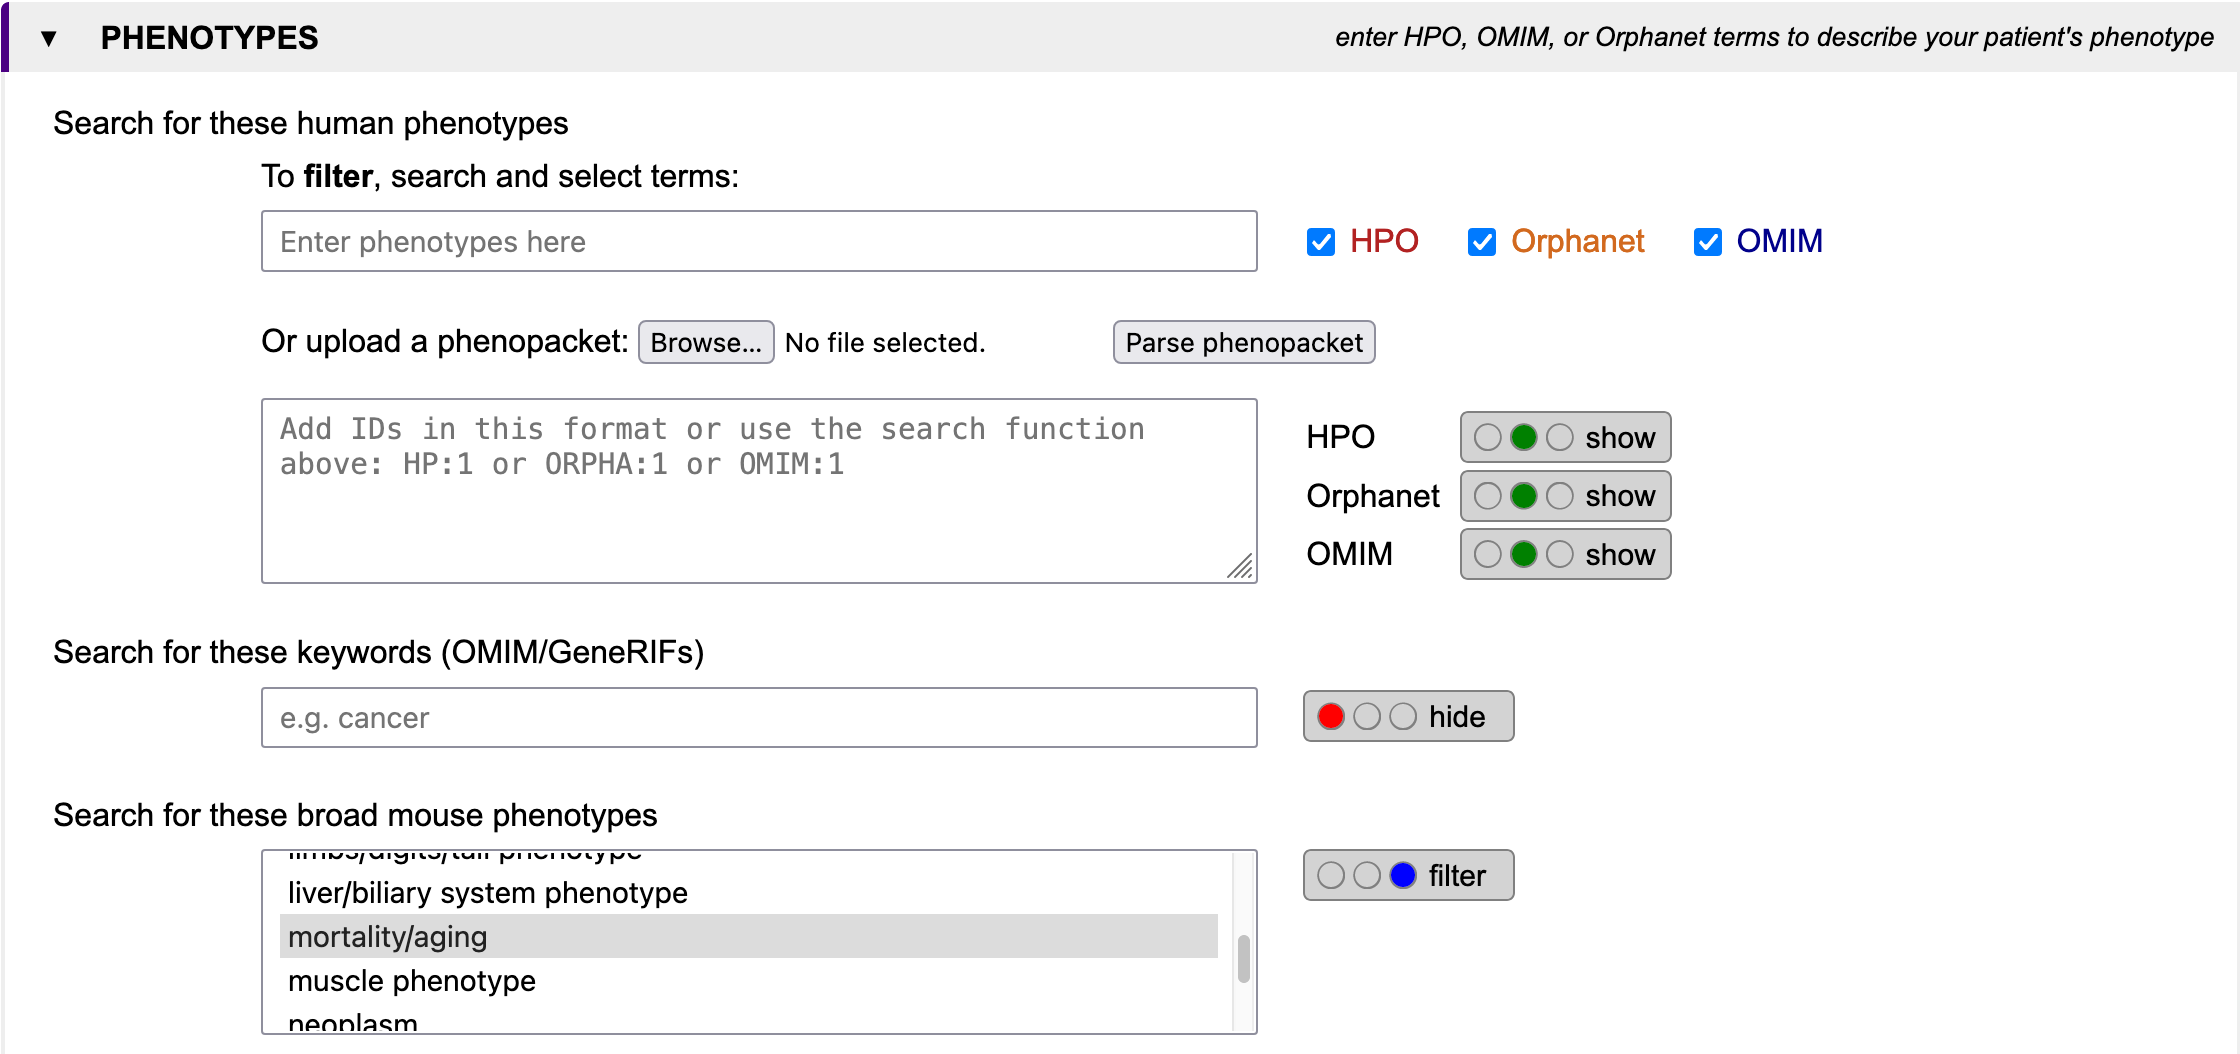
Search for these keywords (OMIM / GeneRIFs)
Type in comma-separated keywords to search for in OMIM reports and GeneRIFs to be highlighted in the output.
You may also upload a GA4GH Phenopacket.
Example: HPO_ORPHA_OMIM.json.
Use the radio buttons to either show or filter the output to genes with at least one of these words in their
reports.
Search for these human phenotypes
When looking for genes linked to specific diseases, displaying and filtering for phenotypes may be helpful. In GenDaB we store human disease descriptions from OMIM and Orphanet, as well as clinical signs and symptoms in humans provided by the Human Phenotype Ontology (HPO). Genes are linked to OMIM disease descriptions and/or HPO terms using data from NCBI MedGen. By selecting IDs or terms from OMIM, Orphanet and/or HPO, you can further refine your search. First select with the radio buttons whether to hide, show or filter the results for each ontology. If you want to filter the genes by human phenotypes, you may either search and select terms or put in IDs directly. IDs need to adhere to the following format:Example:
ORPHA:456
OMIM:789
To search for HPO, Orphanet and OMIM terms, first choose in which data sources to look for with the checkboxes. Then enter at least four letters into the field Enter phenotypes here to look for the search term. A list will open containing IDs with descriptions matching the search term. Choose from the list by clicking on a term.
Search for these broad mouse phenotypes
Select one or more mouse phenotypes to filter your search. To select multiple options, press CTRL while clicking on terms.
Molecular function & Pathways
When looking for candidate genes, you may also be interested in information provided through Gene Ontology, Reactome and WikiPathways. These data sources are utilized in the Molecular function section of the query mask.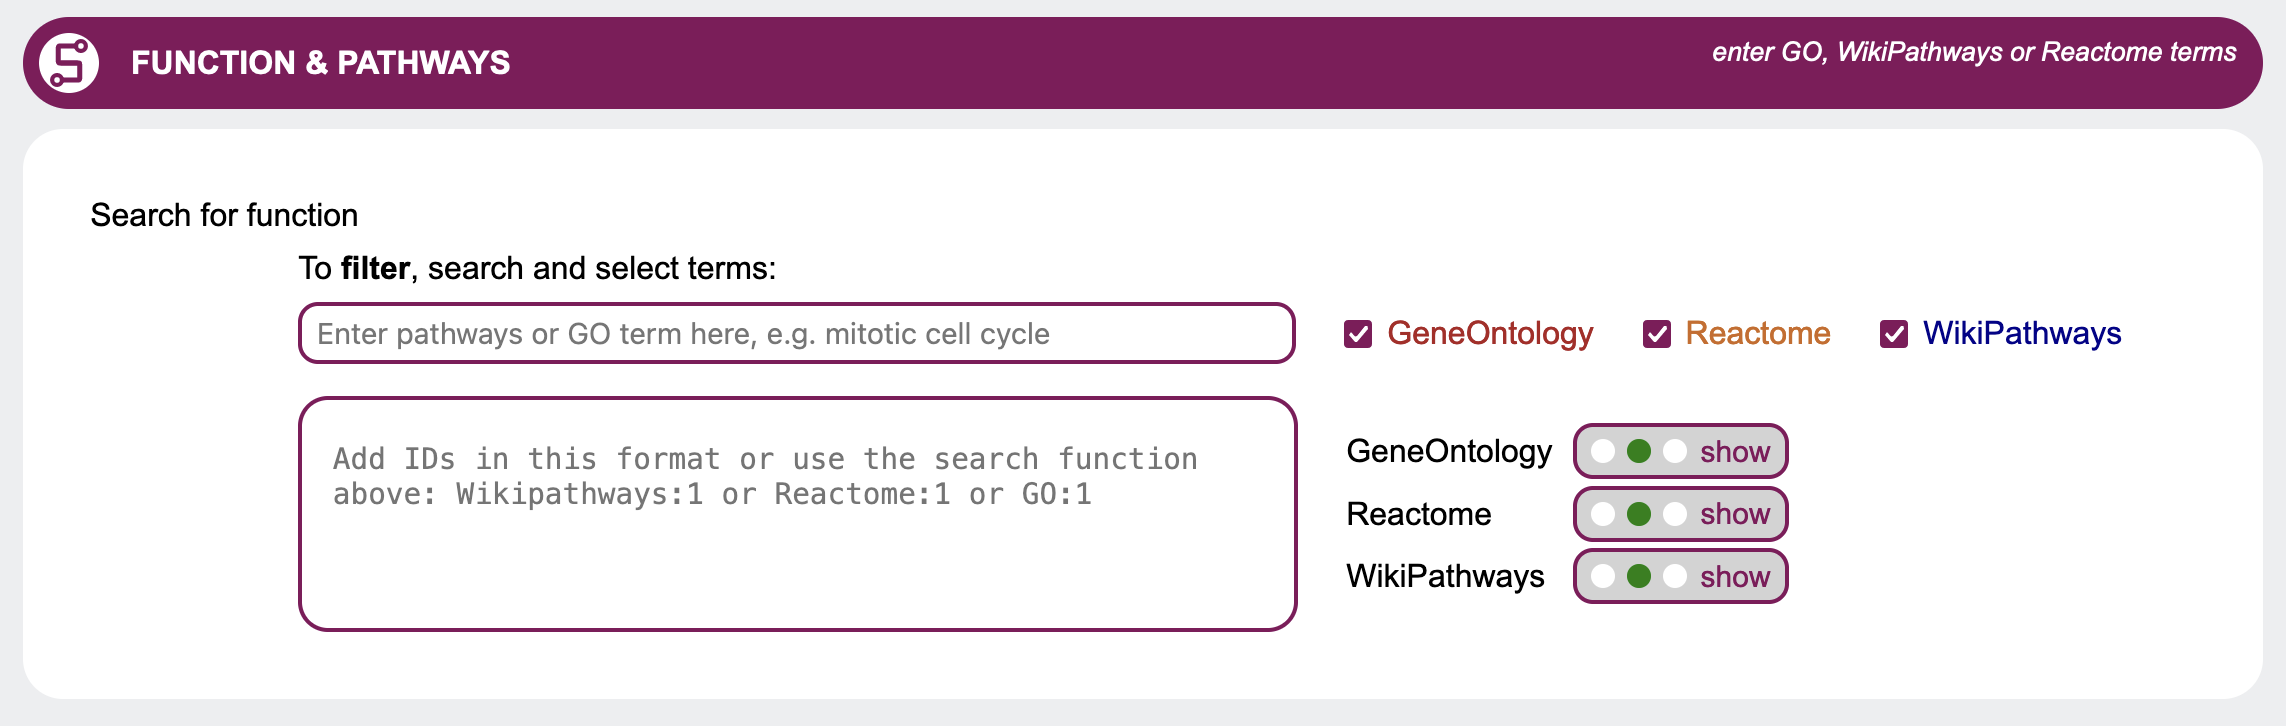 Use the radio buttons to select whether to hide, show or filter the results using Gene Ontology,
Reactome and/or WikiPathways.
If you want to filter the genes by one of these, you may either search and select terms or put in IDs
directly.
IDs need to adhere to the following format:
Use the radio buttons to select whether to hide, show or filter the results using Gene Ontology,
Reactome and/or WikiPathways.
If you want to filter the genes by one of these, you may either search and select terms or put in IDs
directly.
IDs need to adhere to the following format:Example:
Reactome:789
WikiPathways:456
To search for Gene Ontology, Reactome and WikiPathways terms, first choose in which data sources to look for your search term with the checkboxes. Then enter at least four letters into the field Enter pathways or GO terms here to look for the search term. A list will open containing IDs with descriptions matching the search term. Choose from the list by clicking on a term.
Interactions
Protein-protein interactions (PPIs) are a key element in the understanding of cellular processes.
GenDaB enables the user to search for genes encoding proteins that interact with the encoded proteins of your
candidate genes by using
annotations provided by the STRING database.
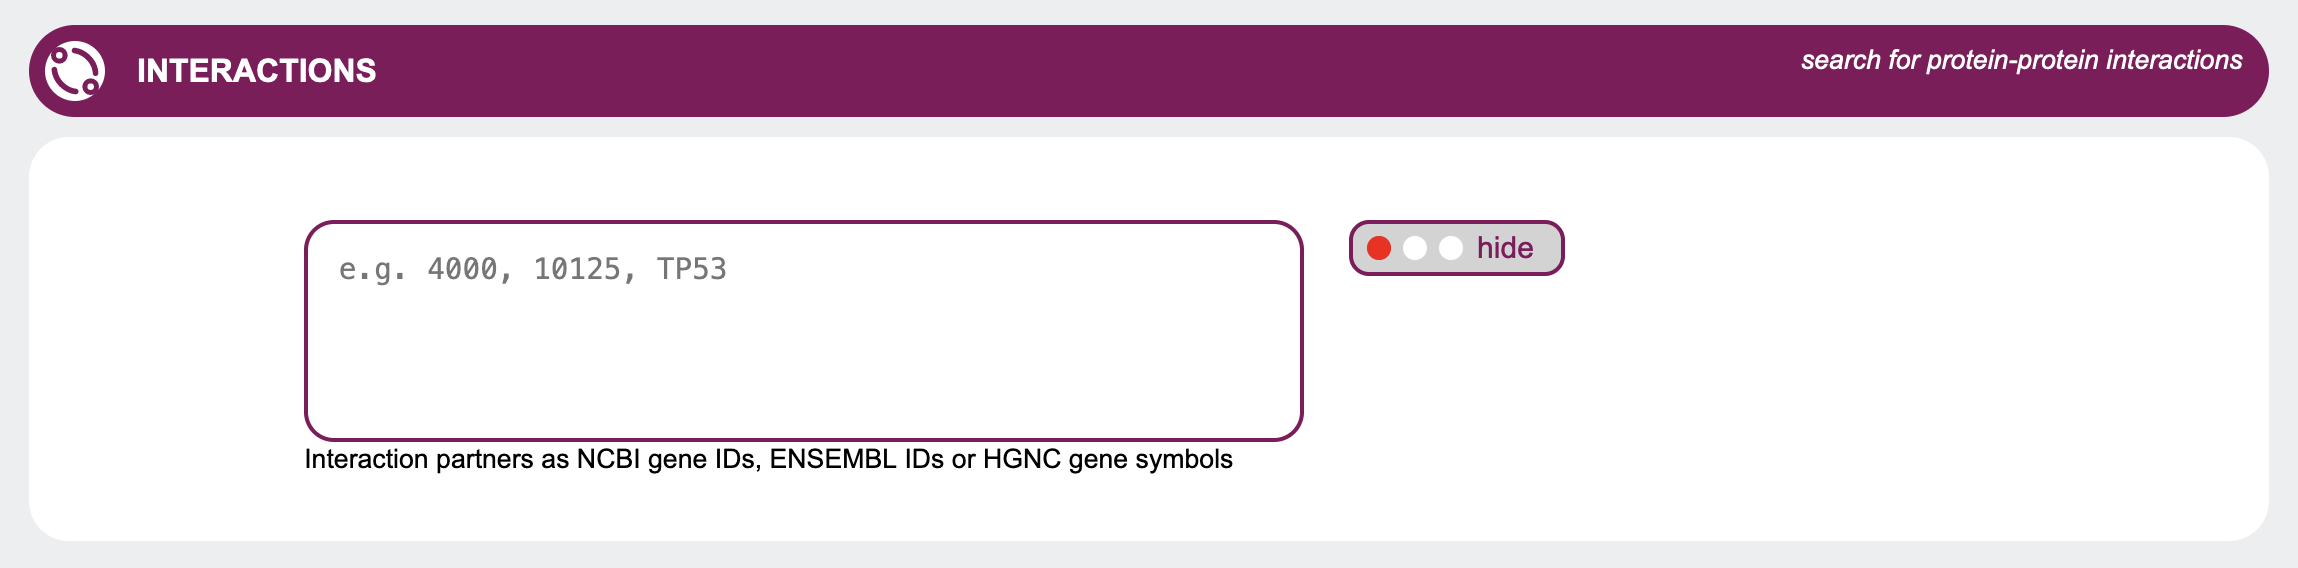 The radio button in this section allows the user to choose whether to hide or show
such interaction annotations in the output.
The radio button in this section allows the user to choose whether to hide or show
such interaction annotations in the output.
Additionally, when setting the radio button to filter, the output can be restricted to candidate genes whose proteins are known to interact with proteins specified by the user.
The genes of interest must be entered into the text area as a comma-separated list of NCBI gene IDs or HGNC gene symbols.
Expression
You may be interested to see which organs or tissues your candidate genes are expressed in. This selection allows
you to customize the expression output according to your areas of interest.
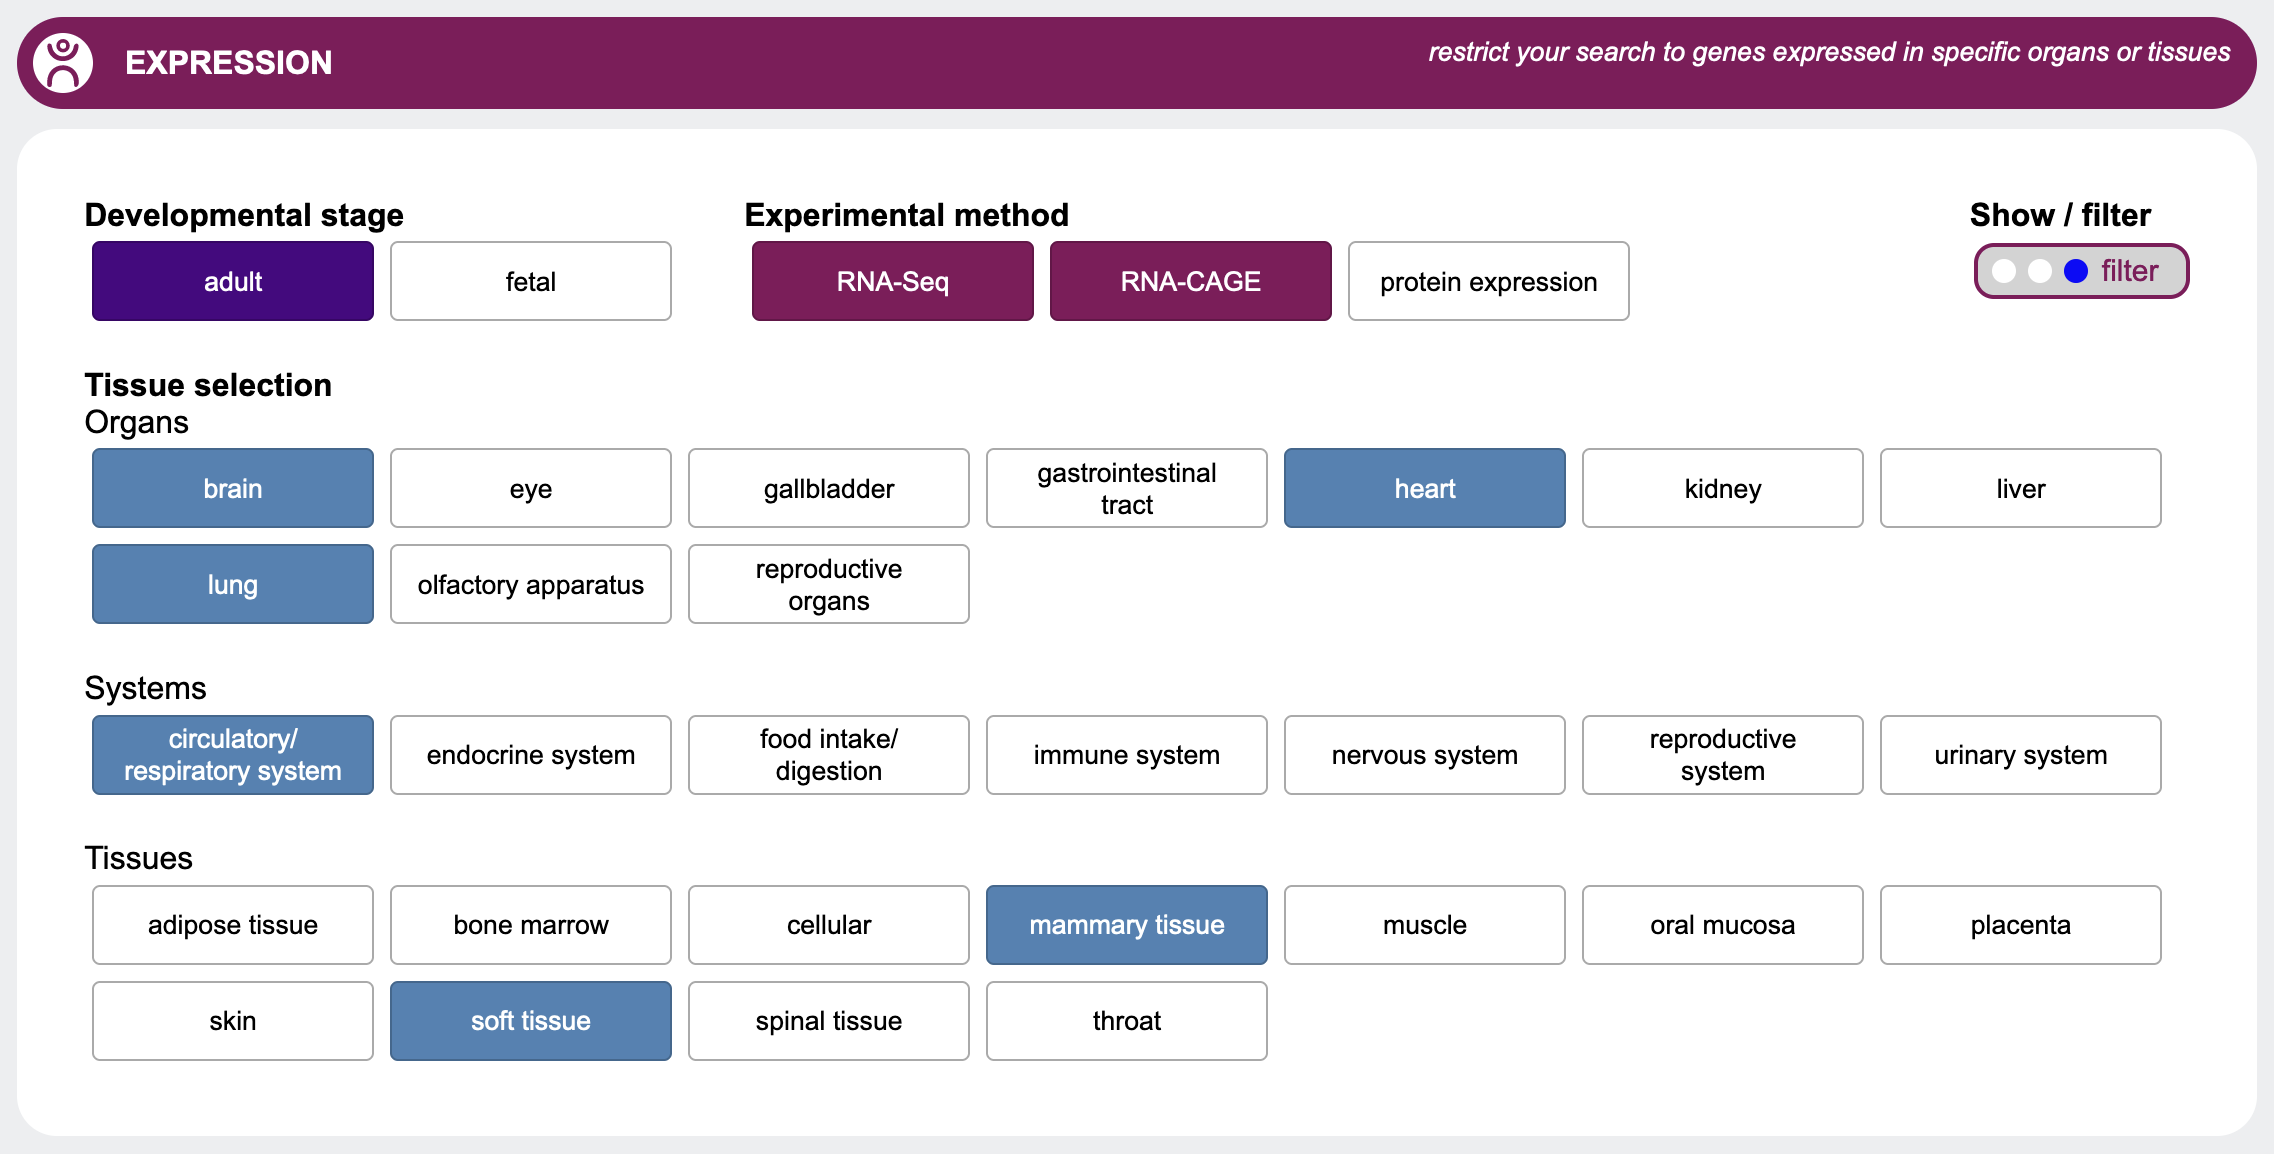 First select with the radio buttons whether to hide, show or filter the results.
If you expect your candidate gene to be expressed in a certain organ, system or tissue, you may filter your
output by selecting one of the options here.
In addition, you can select the developmental stage as well as the experimental method you're interested in.
Please note that for expression, GenDaB filters out only those genes which, according to our data, are explicitly not expressed in a certain tissues.
Genes for which there is no data indicating that they are expressed or not expressed in the selected tissues, will still be included in the output.
First select with the radio buttons whether to hide, show or filter the results.
If you expect your candidate gene to be expressed in a certain organ, system or tissue, you may filter your
output by selecting one of the options here.
In addition, you can select the developmental stage as well as the experimental method you're interested in.
Please note that for expression, GenDaB filters out only those genes which, according to our data, are explicitly not expressed in a certain tissues.
Genes for which there is no data indicating that they are expressed or not expressed in the selected tissues, will still be included in the output.
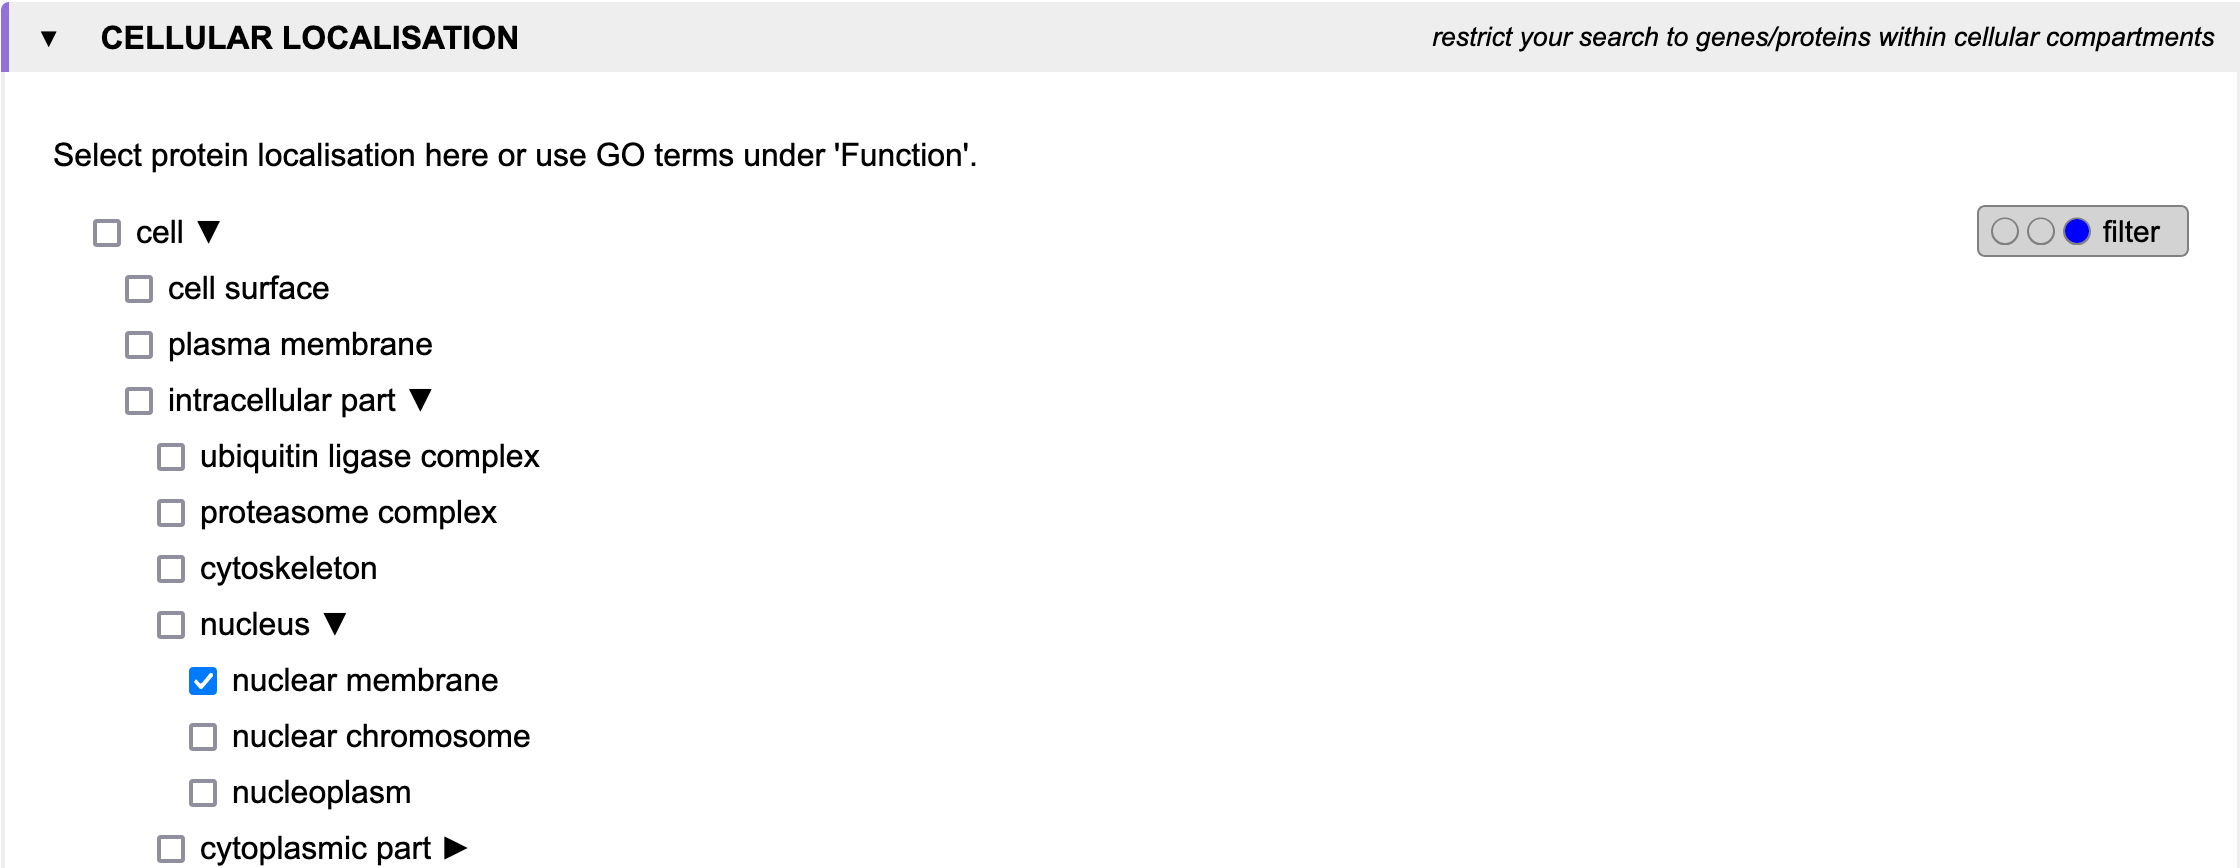
Cellular localisation
When searching for genes of interest, it is often helpful to restrict the search to genes whose gene products are found in
certain cellular compartments. This can be done by selecting the respective checkboxes in the
Cellular localisation section.
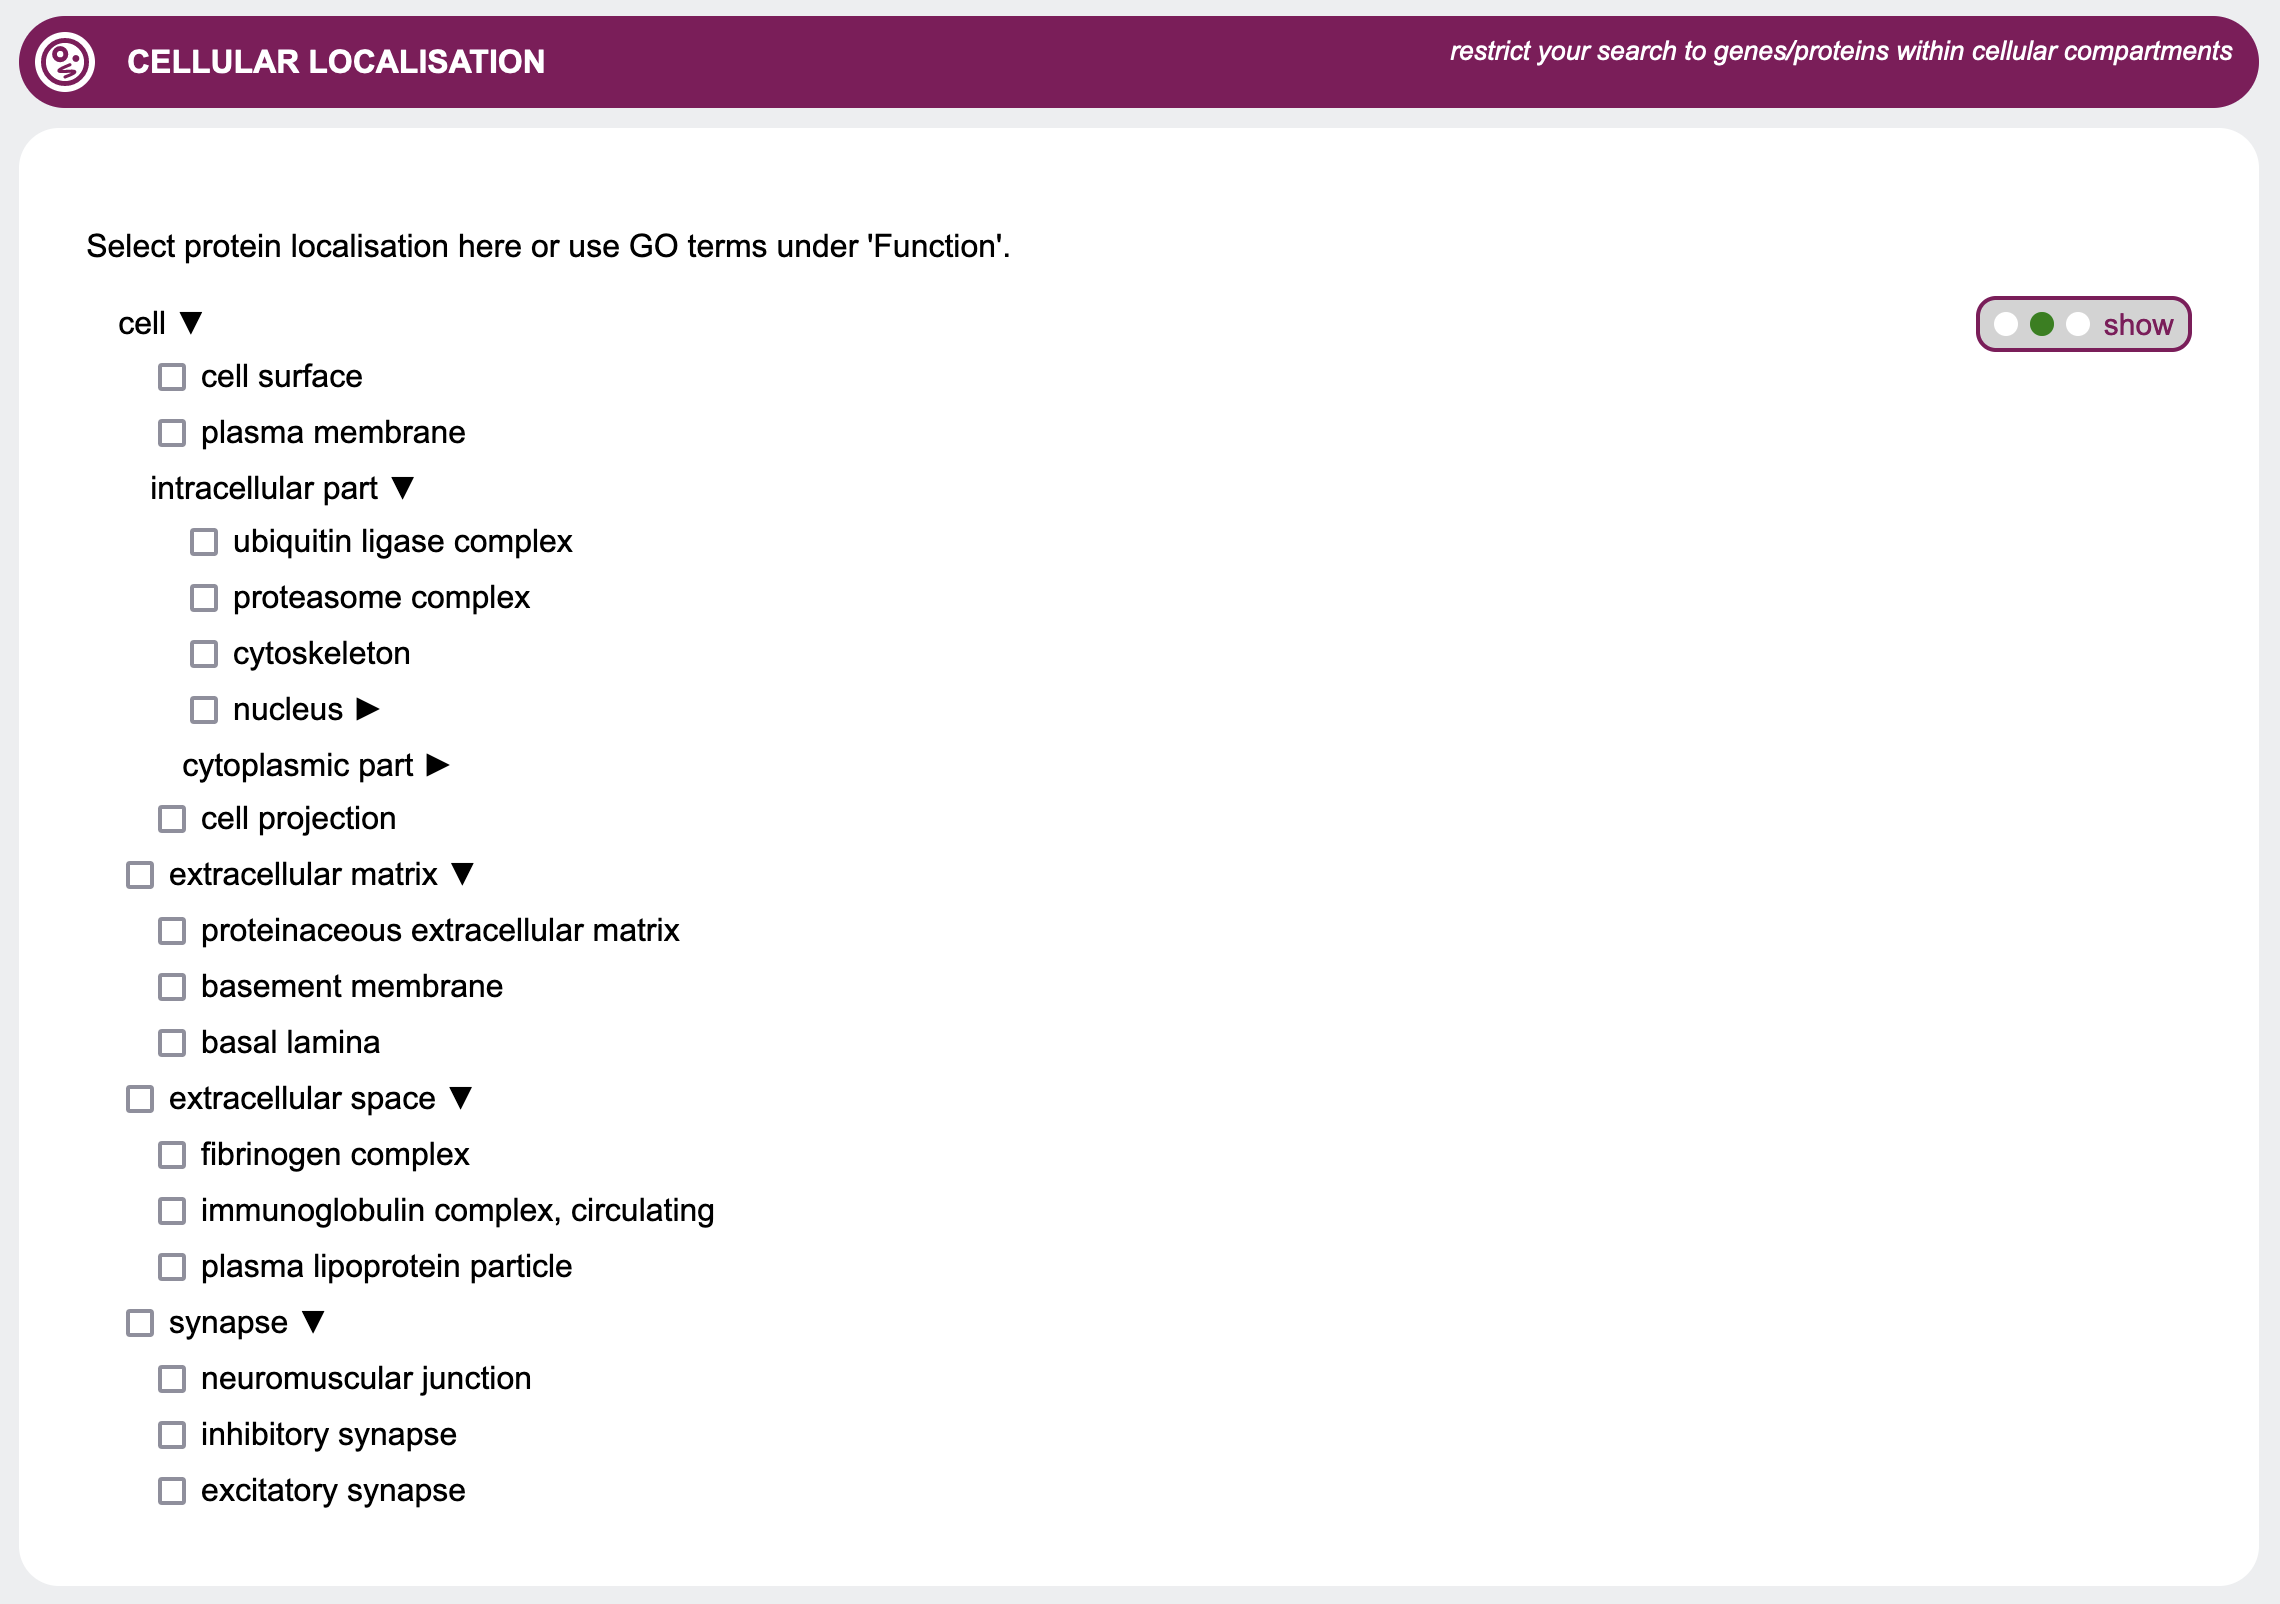 Since these terms are based on the Gene Ontology, they are organized in a hierarchical structure.
Thus, selecting a term will also select all its sub-terms.
However, to enable a more fine-grained control, GenDaB offers the possibility to select only a subset of the
sub-terms.
To do so, expand the parent terms to show all their sub-terms and select the terms of interest.
Since these terms are based on the Gene Ontology, they are organized in a hierarchical structure.
Thus, selecting a term will also select all its sub-terms.
However, to enable a more fine-grained control, GenDaB offers the possibility to select only a subset of the
sub-terms.
To do so, expand the parent terms to show all their sub-terms and select the terms of interest.
Now only genes that are annotated with the selected terms will be displayed in the output, when the radio button is set to filter.
Output
Once you are finished with your input and selections on the query mask and send your query by pressing the Search button, you will be forwarded to the output/result page. This page will supply you with rich information on the candidate genes that fit all your input parameters.
General overview
When the output page opens, you will be presented with a sidebar and a list of genes, which can be collapsed and expanded by either clicking on the individual bar of a single gene or using the Expand/Collapse all genes button in the sidebar.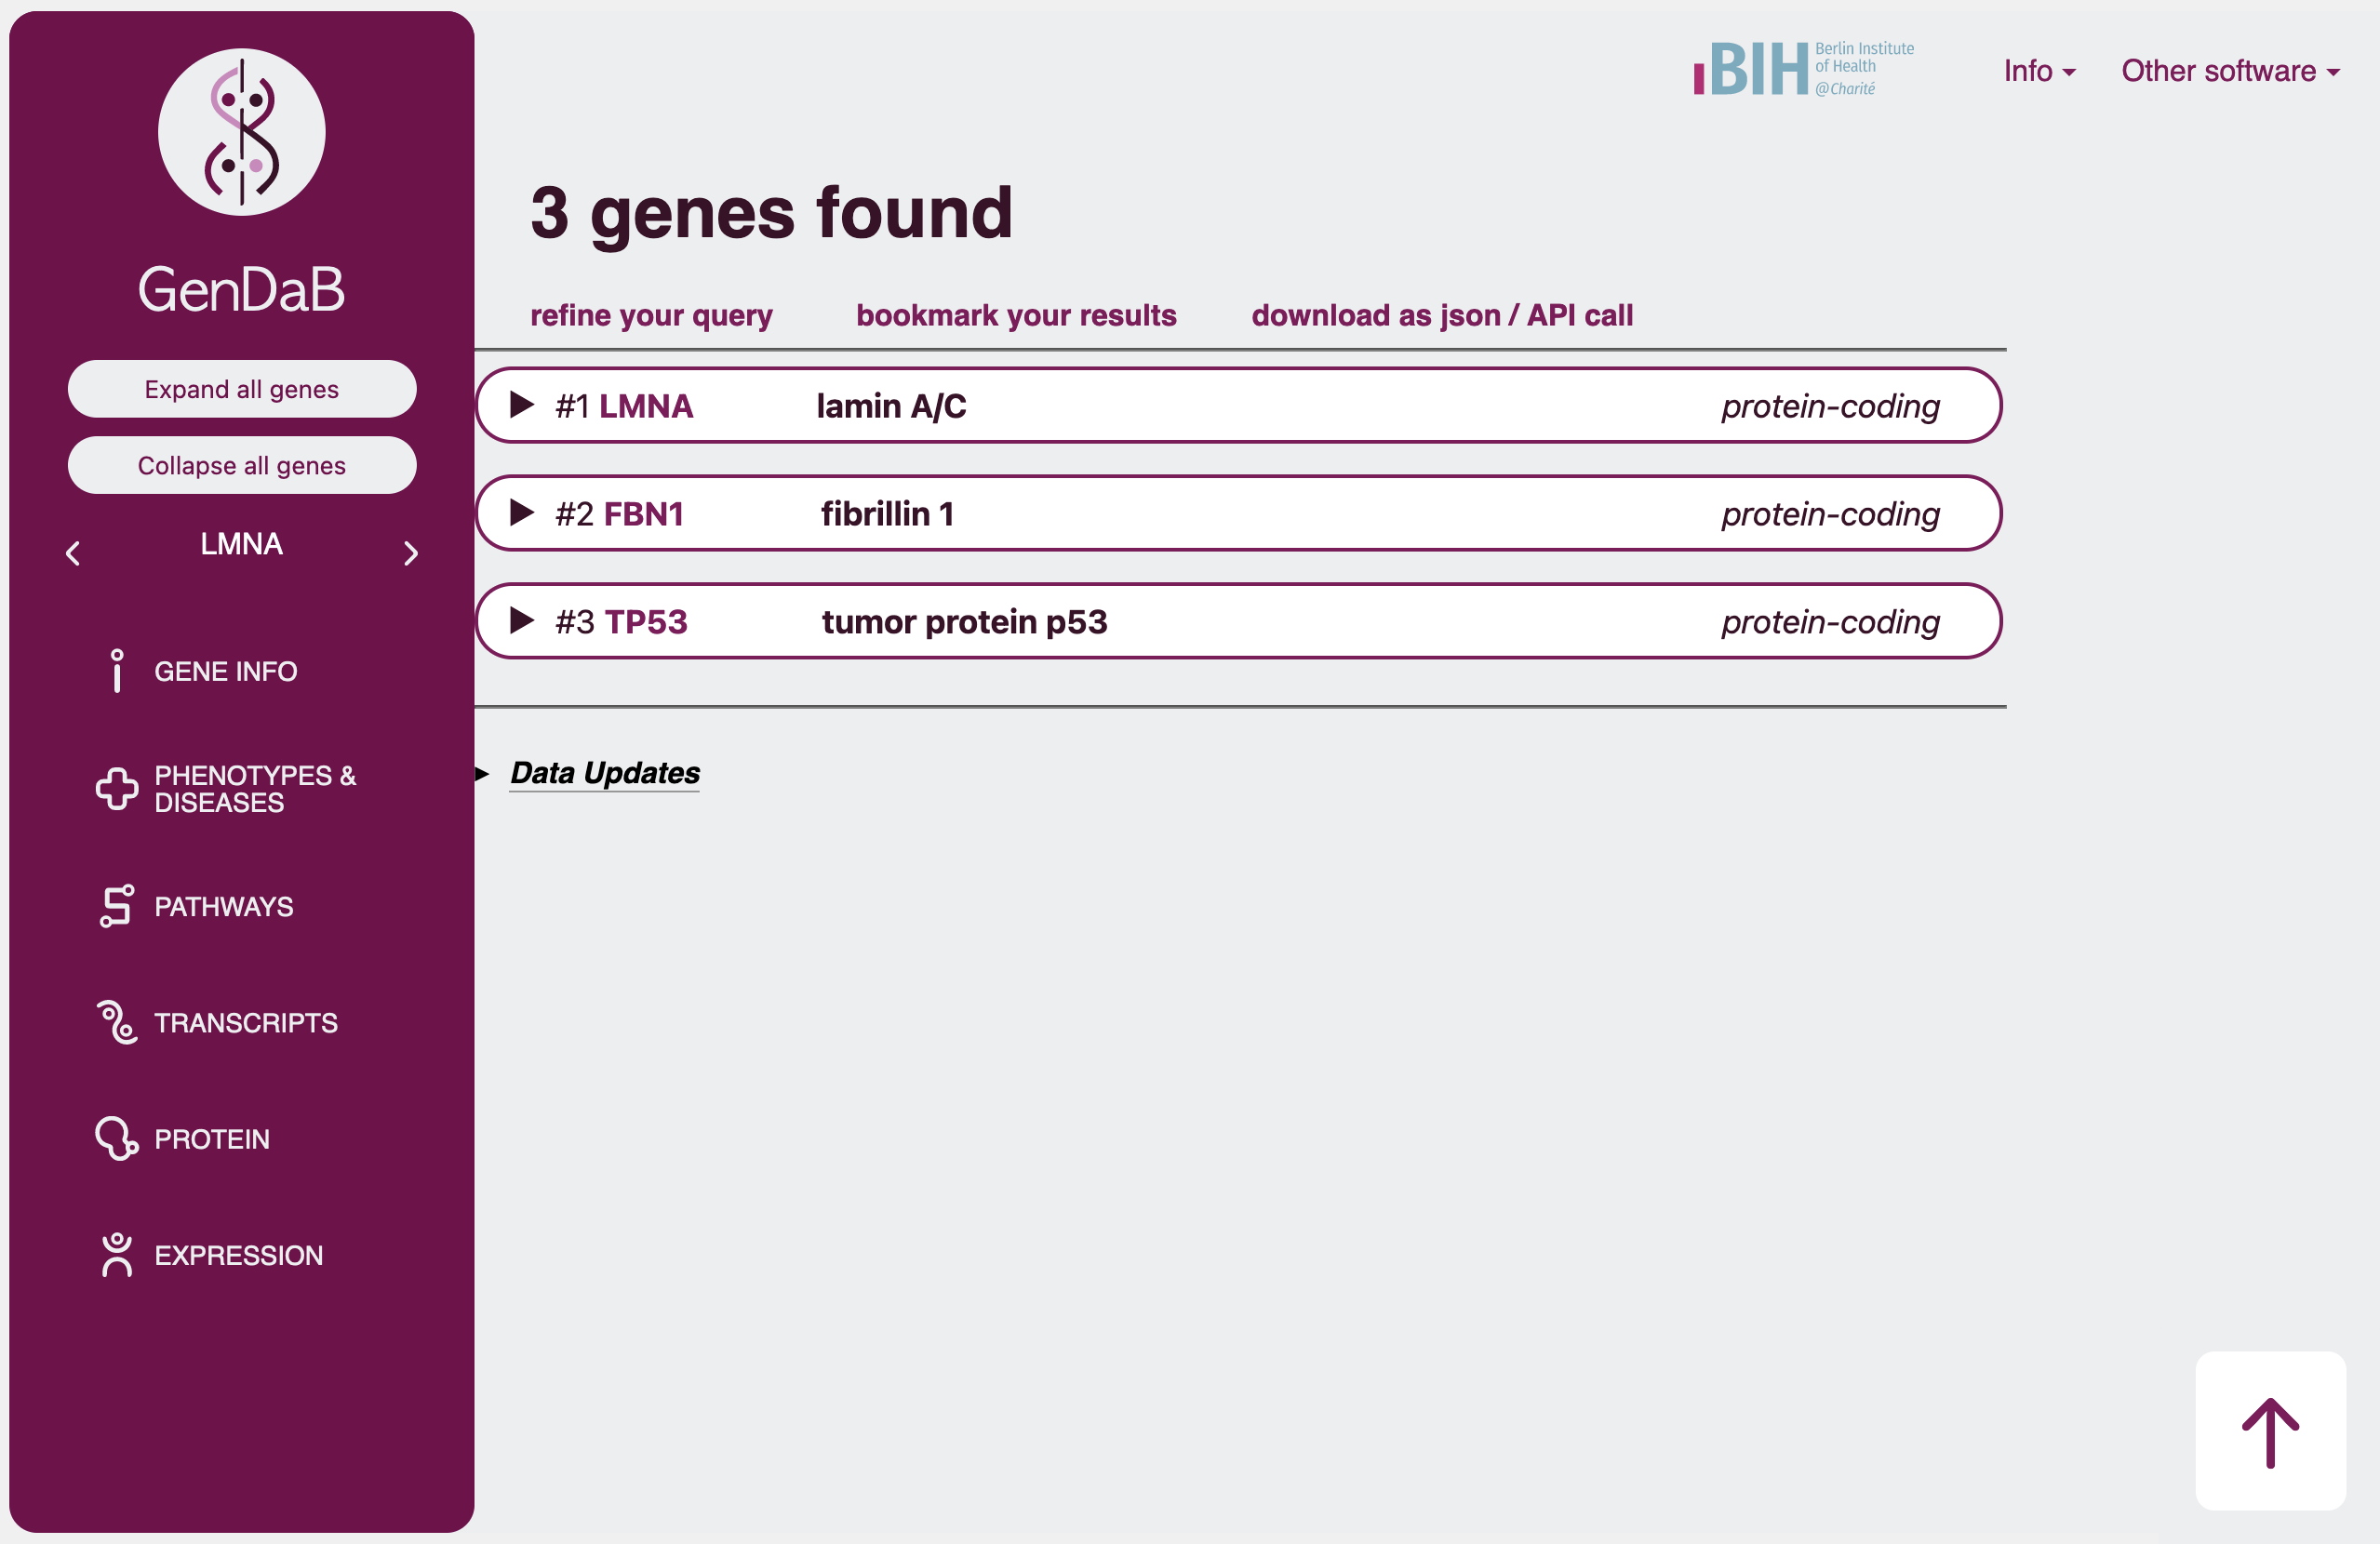 The collapsed genes will only display the gene symbol, name and, if selected and applicable, a flag for ACMG actionable genes.
On top of the page, the number of genes found through your query will be displayed, along with the following options:
- refine your query: go back to the query mask with all your previous input saved and further adjust your search parameters
- bookmark your results: open your results with an URL that you can save/bookmark to find your results again at a later time
- download as json: use our API to download your results in json format
Sidebar navigation
The sidebar on the left of the result page can help you easily navigate through all the displayed information. In the upper section you can find the Collapse/Expand all genes buttons, as well as the currently "active" gene.
 Using the arrow buttons left and right of the displayed gene symbol you can navigate through the genes in your results. By switching to another gene this will expand the corresponding gene on the right if it is collapsed.
 The "active" gene symbol that is selected in the sidebar will influence the lower section of the sidebar. Clicking on the the different sections such as gene info will make the page jump to the corresponding section of the currently active gene.
E.g. if you have a list of ten genes in your output and the third gene is selected in the sidebar and you then click on the Phenotypes & Diseases section in the sidebar, the page will jump to the Phenoytpes & Diseases section of the third gene.
When scrolling through the sections, the sidebar will also respond by highlighting the currently displayed section. Additionally, scrolling from one gene to the next will automatically switch the selected gene in the sidebar.
The "active" gene symbol that is selected in the sidebar will influence the lower section of the sidebar. Clicking on the the different sections such as gene info will make the page jump to the corresponding section of the currently active gene.
E.g. if you have a list of ten genes in your output and the third gene is selected in the sidebar and you then click on the Phenotypes & Diseases section in the sidebar, the page will jump to the Phenoytpes & Diseases section of the third gene.
When scrolling through the sections, the sidebar will also respond by highlighting the currently displayed section. Additionally, scrolling from one gene to the next will automatically switch the selected gene in the sidebar.
Gene specific information
Once you expand a gene, a lot of information on this gene will be on display. Some of this data is shown by default, some will only be shown when it is selected via the display option or show/filter radio buttons
(see section Display options in Query mask).
 Sections, where the provided information is very long will be collapsed within the gene and can be expanded using the ⏵ and collapsed again using the
⏷ icon. Scroll bars next to a section further indicate that a section is collapsed and not all information is displayed.
Sections, where the provided information is very long will be collapsed within the gene and can be expanded using the ⏵ and collapsed again using the
⏷ icon. Scroll bars next to a section further indicate that a section is collapsed and not all information is displayed.
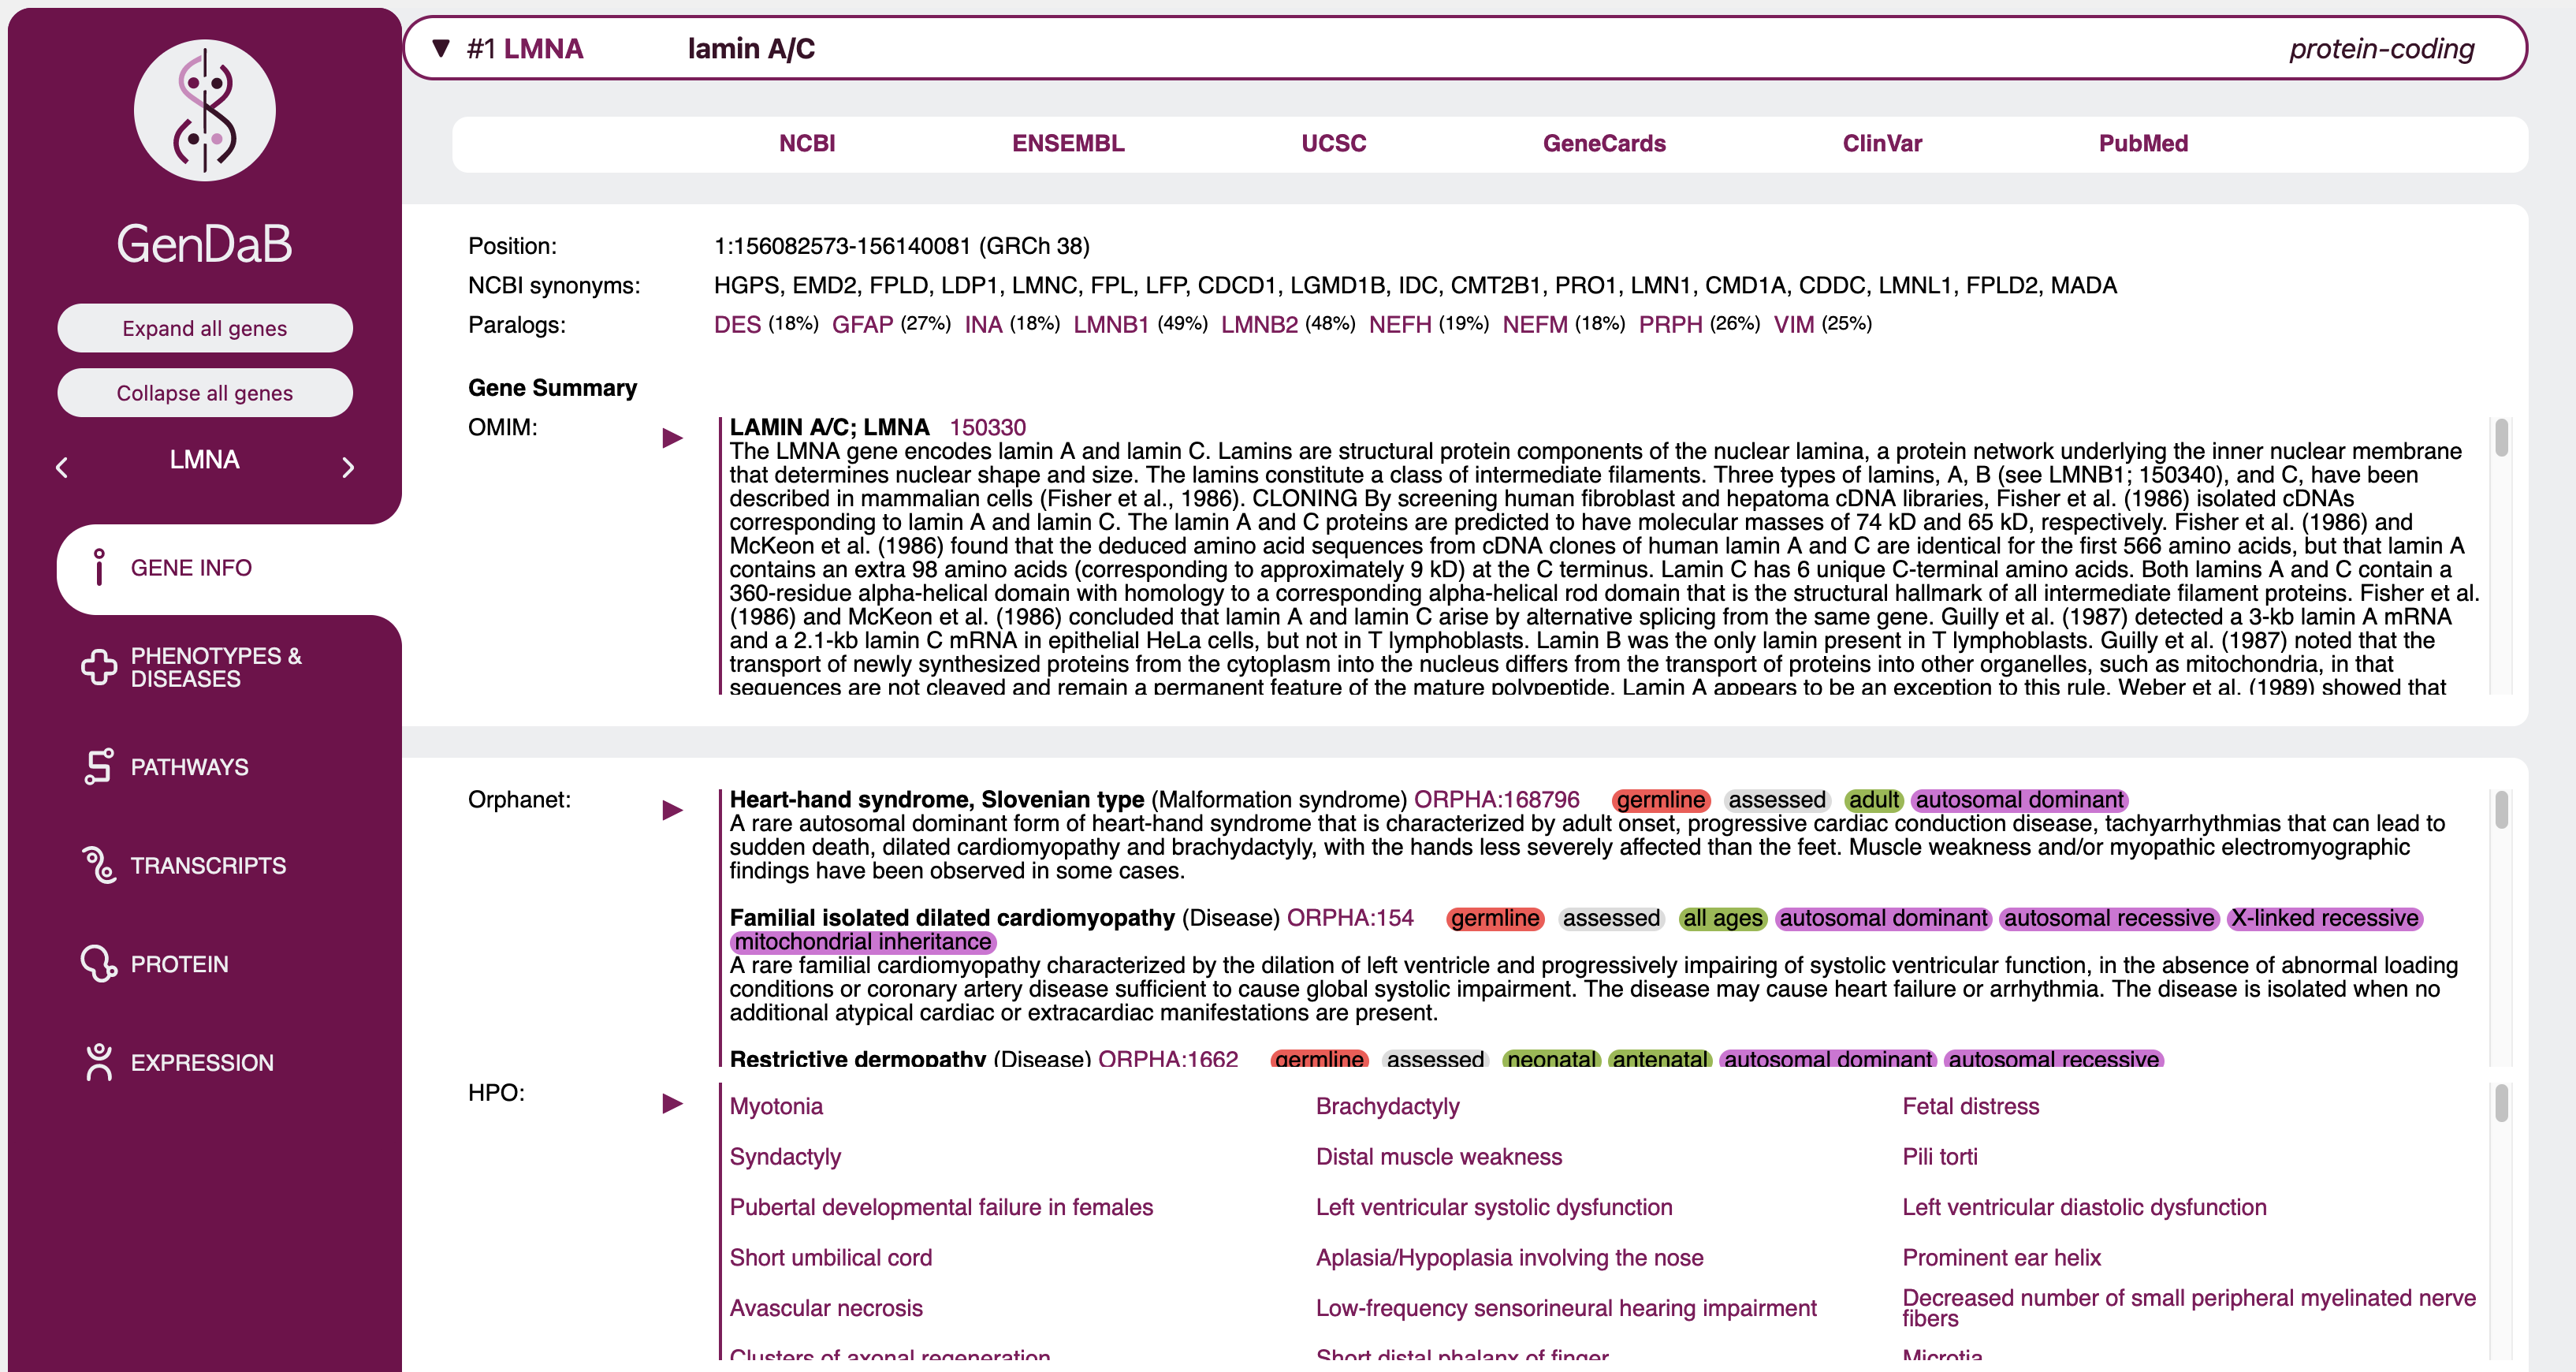
 The data shown in the result table is entirely configurable in the query mask. The only sections that are always shown no matter the selections are the gene symbol, name and type in the gene's expandable tab, as well as
basic information in the first expanded line such as chromosome, positions and genome version.
The data shown in the result table is entirely configurable in the query mask. The only sections that are always shown no matter the selections are the gene symbol, name and type in the gene's expandable tab, as well as
basic information in the first expanded line such as chromosome, positions and genome version.
All other information can be configured. Some sections will be shown by default and can be hidden and some will be hidden by default and can be set to show on the query mask.
Section overview
| Section | Shown by default | Description |
|---|---|---|
| Links | yes | Provides a number of link outs to NCBI, ENSEMBL, GeneCards and PubMed for further information on the gene. Each of these link outs can be individually hidden or shown via the display options on the query mask. |
| UniProt | yes | Provides link outs to proteins associated with the gene found in UniProt. |
| Paralogs | yes | Lists genes with protein paralogs for the queried gene and links to the GenDaB output for those genes. |
| InterPro domains | yes | Lists and links out to protein domains found via InterPro. |
| PFAM | yes | Lists and links out to protein families found via PFAM (now integrated in InterPro). |
| WikiPathways | yes | Lists and links to pathways associated with the queried gene found through WikiPathways. |
| Reactome pathways | yes | Lists and links to pathways associated with the queried gene found through Reactome. |
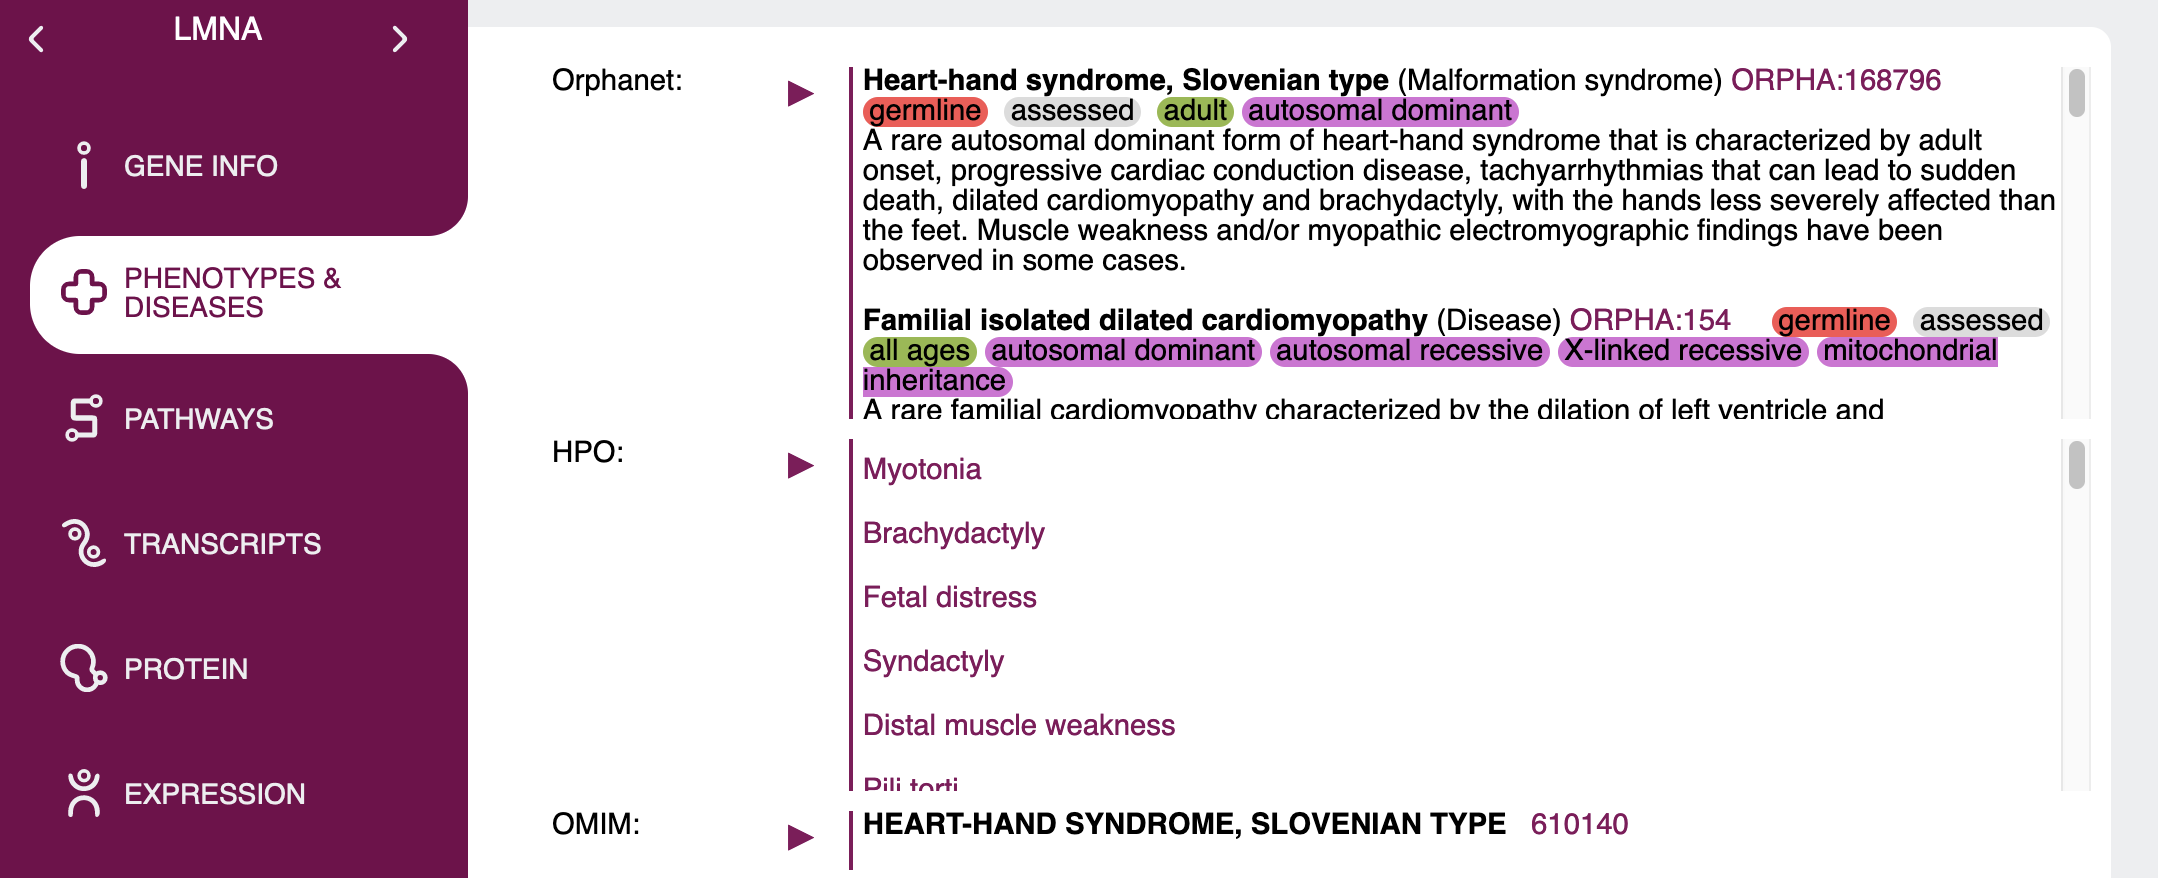
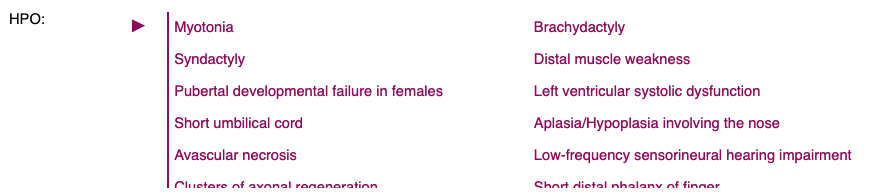
| HPO | yes | Lists and links to associated clinical signs and symptoms in the Human Phenotype Ontology. Genes and HPO terms are linked using data from NCBI MedGen. |
| Orphanet | yes | Lists and links to associated disease descriptions in Orphanet and shows additional information such as somatic, germline, candidate gene tested, loss/gain of function etc. in colour-coded labels for each phenotype when applicable. |
| OMIM | yes | Provides comprehensive phenotype reports as found in OMIM. Unlike other sections, each associated OMIM entry is collapsed in its own section. Additionally, when a specific phenotype has only been confirmed in mice, this will be indicated by a highlighted "only shown in mice" text. Genes and disease descriptions are linked using data from NCBI MedGen. |
| OMIM gene info | yes | Shows the gene specific OMIM report for the queried gene. |
| Transcript summary | yes | An overview of how many transcripts of each category (such as protein-coding or retained intron) are available for the queried gene. By clicking on Show transcripts beneath the "Transcript summary" heading, the full list of relevant transcripts can be displayed. Similarly, clicking on Hide transcripts will return you to the Transcript summary view. |
| Panels | no | Lists and links to those panels selected on the query mask. When no specific panels are selected but the display option is set to show, all panels including Genomics England panels will be displayed. |
| GeneRIFs | yes | A list of functional annotations provided through GeneRIF. |
| Gene Ontology | yes | Lists and links to associated entries in the Gene Ontology. These are divided into three categories as indicated by their headings: localisation, process and function. |
| MPO | yes | Lists and links to associated entries in the Mammalian Phenotype Ontology. |
| Interactions | no | Lists a number of known interaction partners found via STRING. Each protein-coding gene listed links to the corresponding GenDaB entry. Additionally, the score and method (such as experimental or text mining) provided by STRING are shown. By clicking on the method, you will be redirected to the associated entry on the STRING website. Genes which were specifically queried in the interactions tab of the query mask will be marked by a bold "queried" text, whereas genes which are also listed as candidate genes in your output are indicated by a bold "In search" text. |
| Expression | no | The output here will be largely dependant on your selection in the Expression tab of the query mask. Only expression in user selected tissues and developmental stage and through the chosen experimental method will be shown. Please note that when set to filter, the expression output will show genes which are epressed in at least one of the selected tissues as well as genes for which no expression data in GenDaB is available. Only genes for which our data explicitly indicates that they are not expressed in either of the selected tissues will be filtered out. |
For further information on the sources of the shown data, please refer to Integrated data.
Integrated data
GenDaB integrates ~15 external resources, which are updated on a regular basis (last update: 13 August 2023).
For suggestions on other data sources we should include please contact: dominik.seelow (at) bih-charite.de
Tutorial
In this simple tutorial, a typical use case for GenDaB is described. For the gene region on chromosome 15, position 74000000-80000000, we look for all interaction partners of the protein p53.
1. Genomic region of interest:
First enter the gene region in the text field in the "candidate genes, regions or panels" tab.
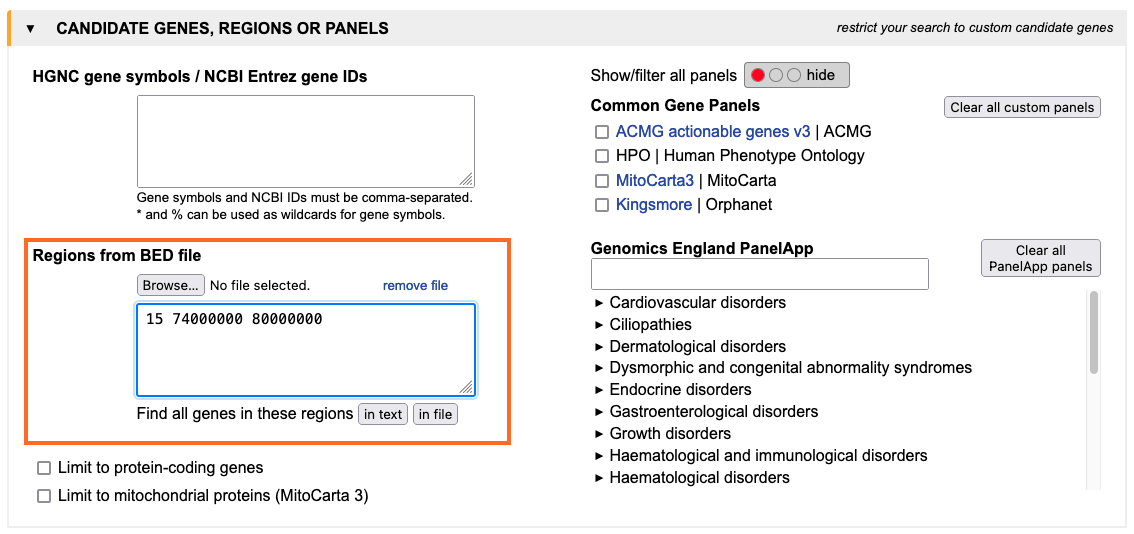 You can also upload a bed file to define regions.
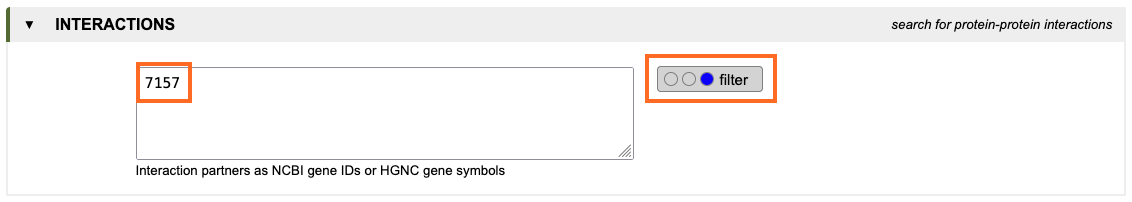
2. Filter for interactions with p53:
To filter for interactions with p53, type the NCBI-ID or gene symbol of the encoding gene TP53 into the text
field of the interaction tab and change the setting of the
radio buttons to filter (blue). With this setting, only genes encoding proteins that are know to interact
with p53 are displayed in the output.
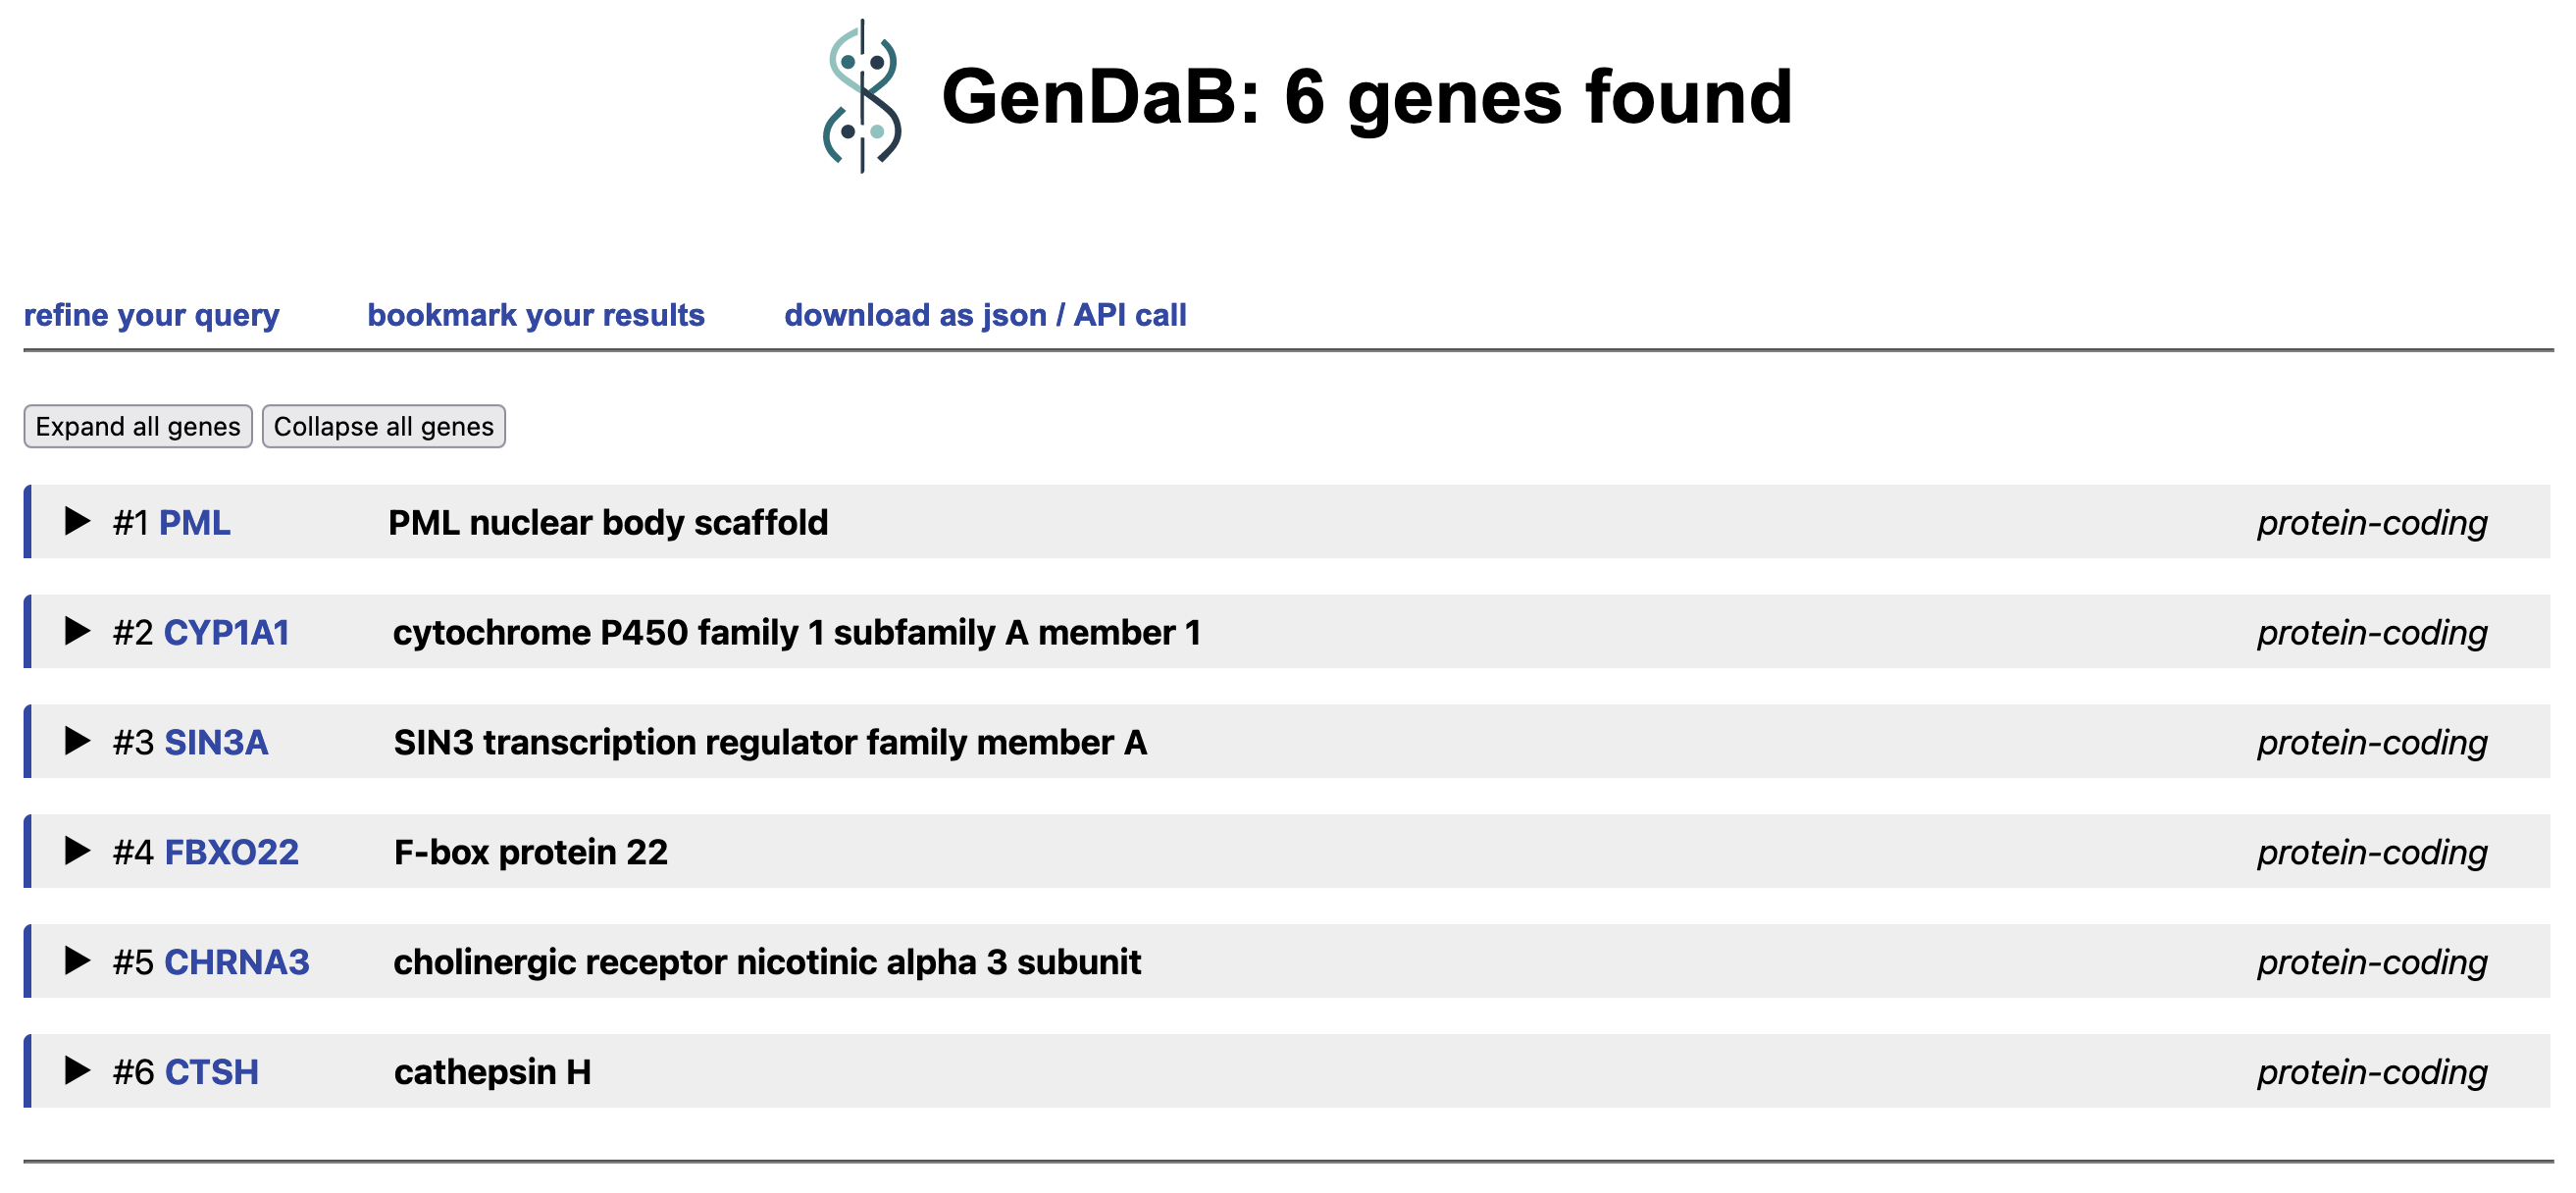
3. Start the query: Press the submit-button to initiate the query.
4. Result exploration:
The result page shows six encoding genes in the genomic regions whose proteins interact with p53,
namely PML, CYP1A1, SIN3A, FBXO22, CHRNA3 and CTSH. Information about a
particular gene can be retrieved by pressing the tab of the gene.
Examples
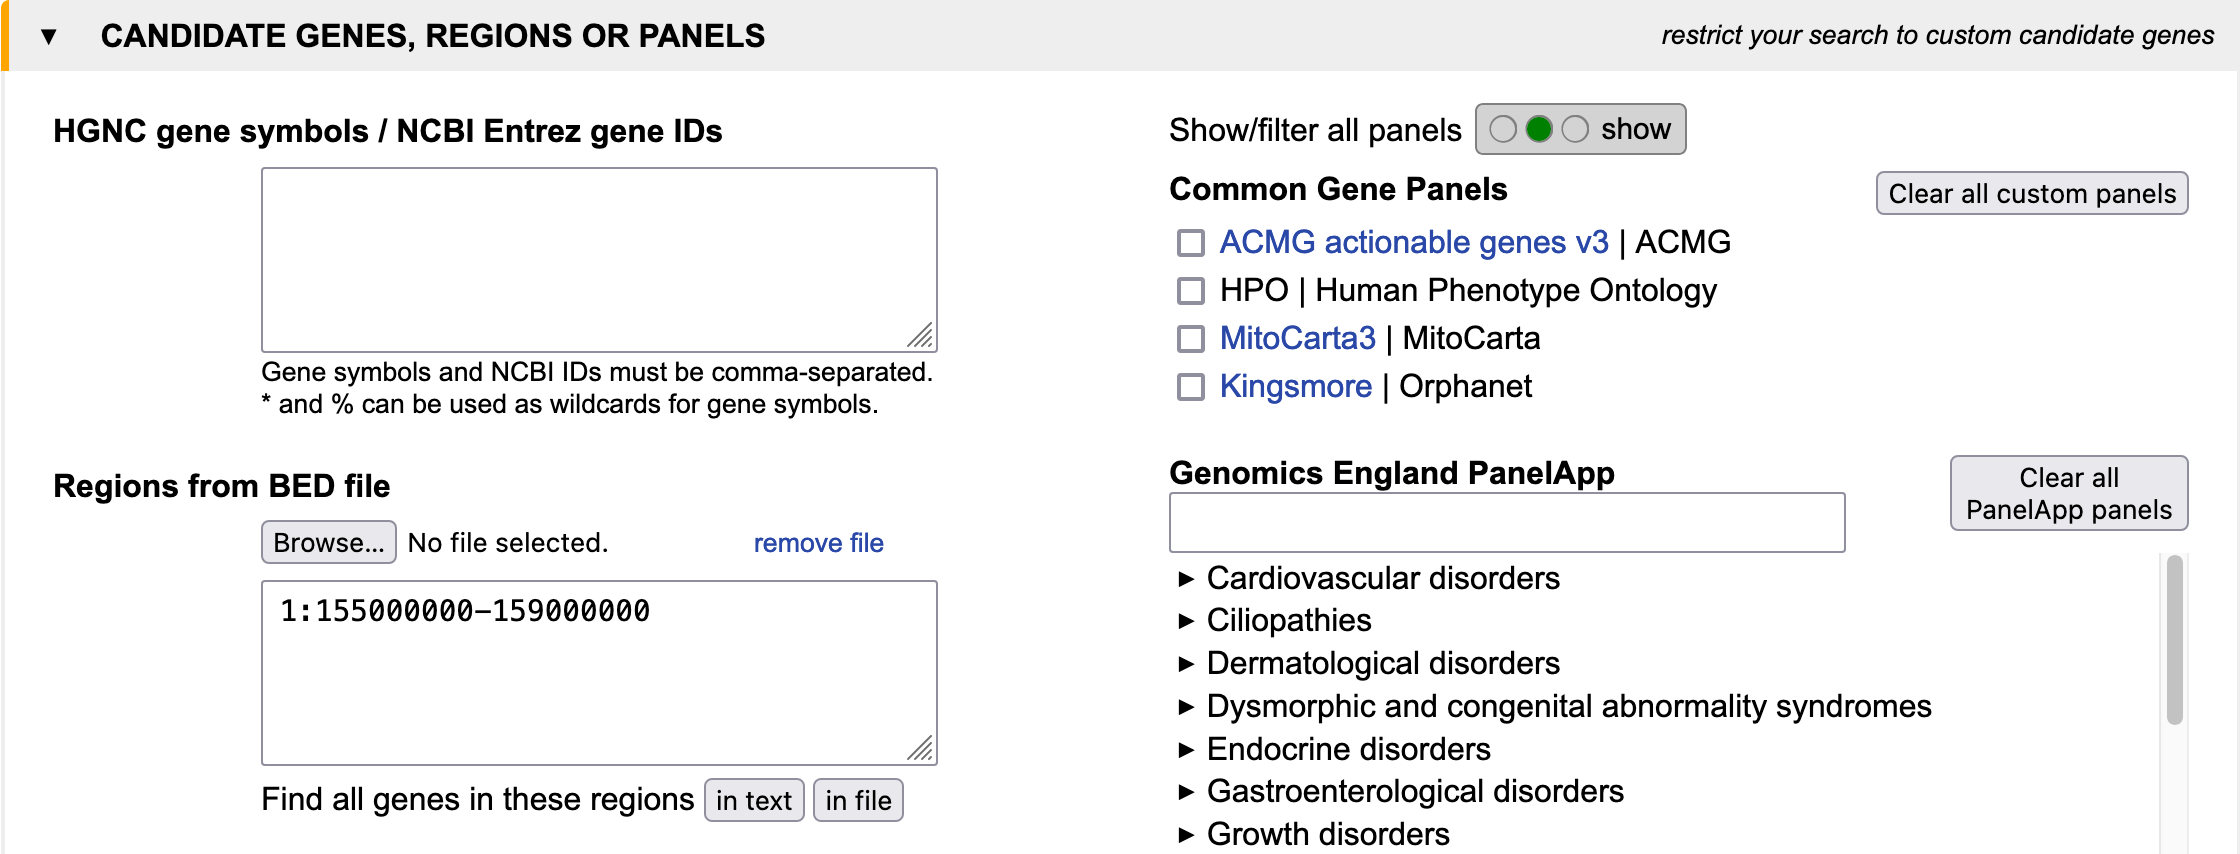
Use case - Progeria
Imagine you have a patient suffering from progeria and find a homozygous deletion on chromosome 1 between 155 and 159 Mbp. You know from electron microscopy that the nuclei are not in good shape. You search for genes which1.) are located within the deletion
2.) cause a murine ageing phenotype
3.) have a gene product located in the nuclear membrane.
See example as Input in query mask or Output.
Step 1:
Step 2:
Step 3:
Simple query examples
In addition to the use case, below we provide a few simple examples on how to use GenDaB for different search goals. Clicking on the Input in query mask will lead you to a pre-filled query mask where you can adjust the settings, whereas clicking on Output will lead you directly to the results.
Example 1
Filter for the keyword "muscular" in the genes LBR, LMNA and FBN1.
See example as Input in query mask or
Output.
Example 2
Look for HPO term Myopathy (HP:3198) in genes ABL1 and ACACA.
See example as Input in query mask or
Output.
Example 3
Filter the genes SOS1 and LMNA for the WikiPathways term "Regulation of actin cytoskeleton".
See example as Input in query mask or
Output.
API
Our API allows you to retrieve data programmatically, making it easy to integrate our server's resources into your own applications or scripts. Whether you prefer AJAX calls, Python scripting, or using curl commands, we've got you covered.
API parameters
Default values are marked in bold pink.| Name | Parameter (API) | Values | Examples | Description |
|---|---|---|---|---|
| JSON Output-Format | json | 0, 1 | json=1 | Retrieve the output in JSON format. |
| Order / Prioritisation | order | position, genesymbol, matching_score | order=genesymbol | Order the output specifically by genesymbol or genomic position. |
| Defining the genes of interest | ||||
| Genome build | genome_version | 37, 38 | genome_version=38 | Genome build to use for the query (GRCh37 or GRCh38). |
| Gene input: All | genesymbol | Gene symbols (or gene IDs) | genesymbol=APP,351 | Enter a comma-separated list of genesymbols (NCBI Gene IDs are also accepted). |
| Gene input: IDs | gene_id | NCBI Gene IDs | gene_id=351,4000 | Enter a comma-separated list of NCBI Gene IDs. |
| Genomic region(s) | beddata | BED-file content, marking the region of interest (separated by commas or line-breaks) | beddata=17:43044295-43125364 | Genomic region(s) of interest. |
| Gene type | gene_type | 0 (all) , 1 (snRNA), 2 (pseudo), 3 (rRNA), 6 (snoRNA), 7 (protein-coding), 8 (tRNA) , 9 (miscRNA), 4 (unknown), 5 (other) | gene_type=7 | Select only protein-coding genes. |
| Mitochondrial proteins | mitochondriome | 0, 1 | mitochondriome=1 | Select only genes of mitochondrial proteins. |
| Gene panels | ||||
| Gene Panel(s) | show_panels | 0, 1, filter | show_panels=1, show_panels=filter |
1: Show gene panels that include the given gene list. Filter: Filter genes according to the selected gene panels. |
| Specific Gene Panel | genepanel_ {panel_number} | 0, 1 | genepanel_265=1 | Selection of specific gene panel for filtering of output genes. |
| Highlighting / Filtering phenotypes | ||||
| Keywords | keywords | Words, separated by commas or spaces | keywords=dementia | Highlight/Filter genes that contain the given keywords in their description (GeneRIFs, OMIM-, and Orphanet-results). |
| Apply keywords | show_keywords | 0, 1, filter | show_keywords=1, show_keywords=filter |
1: Highlight (only in non-JSON output) genes that contain the given keywords in their
description (GeneRIFs, OMIM-, and Orphanet-results). Filter: Filter genes that contain the given keywords in their description (GeneRIFs, OMIM-, and Orphanet-results). |
| Phenotype | phenotype | HPO-IDs (e.g. HP:726), OMIM-IDs (e.g. OMIM:607822), Orphanet-IDs (e.g. ORPHA:238616) | phenotype=HP:726 |
Select HPO-, OMIM-, or Orphanet-IDs to highlight/ filter genes that are associated with the
given
phenotype. Required: Activate highlighting/ filtering with show_hpo or show_omim or show_orphanet. |
| HPO | show_hpo | 0, 1, filter | show_hpo=1, show_hpo=filter |
1: Highlight (only in non-JSON output) genes that are associated with the given
HPO-IDs. Filter: Filter genes that are associated with the given HPO-IDs. |
| OMIM | show_omim | 0, 1, filter | show_omim=filter |
1: Highlight (only in non-JSON output) genes that are associated with the given
OMIM-IDs. Filter: Filter genes that are associated with the given OMIM-IDs. |
| Orphanet data | show_orphanet | 0, 1, filter | show_orphanet=filter |
1: Highlight (only in non-JSON output) genes that are associated with the given
Orphanet-IDs. Filter: Filter genes that are associated with the given Orphanet-IDs. |
| MPO / MGD | phenotype | MGD/MPO-IDs (comma-separated) | phenotype=MP:0005386, MP:0002006 | Select MPO-IDs to highlight/ filter genes that are associated with the given phenotype. |
| Apply MPO / MGD phenotypes | show_mpo | 0, 1, filter | show_mpo=1, show_mpo=filter |
1: Highlight (only in non-JSON output) genes that are associated with the given
MPO-IDs. Filter: Filter genes that are associated with the given MPO-IDs. |
| Highlighting / Filtering functional features | ||||
| Selection: Function | function | Either GO-IDs (e.g. GO:282), Reactome-IDs (e.g. Reactome:174587), or WikiPathways-IDs (e.g. WikiPathways:2870) | molecularfunction=GO:278, Reactome:174587, WikiPathways:2870 | Select GO-, Reactome-, or WikiPathways-IDs to highlight/ filter genes that are associated with the given function. |
| Wikipathways | show_wikipathways | 0, 1, filter | show_wikipathways=1, show_wikipathways=filter |
1: Highlight (only in non-JSON output) genes that are associated with the given
WikiPathways-IDs. Filter: Filter genes that are associated with the given WikiPathways-IDs. |
| Reactome | show_reactome | 0, 1, filter | show_reactome=1, show_reactome=filter |
1: Highlight (only in non-JSON output) genes that are associated with the given
Reactome-IDs. Filter: Filter genes that are associated with the given Reactome-IDs. |
| Gene Ontology (GO) | show_go | 0, 1, filter | show_go=1, show_go=filter |
1: Highlight (only in non-JSON output) genes that are associated with the given
GO-IDs. Filter: Filter genes/proteins that are associated with the given GO-IDs. |
| Protein-protein interactions | ||||
| Selection: STRING Interactions | interactions | NCBI Gene IDs or gene symbols (comma-separated) | interactions=4000,4001 | Highlight/Filter for protein-protein interaction partners by selecting the gene IDs or gene symbols of the encoding genes. |
| STRING Interactions | show_interactions | 0, 1, filter | show_interactions=1, show_interactions=filter |
1: Highlight (only in non-JSON output) the encoding genes of protein-protein interaction partners. Filter: Filter encoding genes whose proteins interact with the encoded protein of the given genes. |
| Expression settings | ||||
| Expression (Switch) | show_expression | 0, 1 | show_expression=1 |
Show expression data. Required: Selection of developmental stage(s), experimental method, and tissue(s). |
| Expression in adult tissue | expression_adult | 0, 1 | expression_adult=1 | Show expression in adult tissues. |
| Expression in fetal tissue | expression_fetal | 0, 1 | expression_fetal=1 | Show expression in fetal tissues. |
| RNA expression (RNA-seq) | expression_rna | 0, 1 | expression_rna=1 | Show RNA expression. |
| Protein expression | expression_protein | 0, 1 | expression_protein=1 | Show protein expression. |
| RNA expression (RNA-CAGE) | expression_cage | 0, 1 | expression_cage=1 | Show expression data from RNA-CAGE experiments. |
| Expression records for tissue {tissue_name} | expression_ {tissue_name} | 0, 1 | expression_brain=1 | Show expression data for the given gene(s)/protein in the selected tissues. |
| Cellular Localisation | ||||
| Cellular compartments | localisation_{GO-ID} | 0, 1 | localisation_5886=1,show_localisation=filter | Select only genes with gene products in the given cellular compartment. |
| Additional resources | ||||
| Synonyms | show_synonyms | 0, 1 | show_synonyms=1 | Show synonyms of the given gene(s). |
| UniProt | show_uniprot | 0, 1 | show_uniprot=1 | Show UniProt data for the given gene(s). |
| Transcripts | show_transcripts | 0, 1 | show_transcripts=1 | Show transcript data for the given gene(s). |
| GeneRIFs | show_generifs | 0, 1 | show_generifs=1 | Show GeneRIFs for the given gene(s). |
| Interpro | show_interpro | 0, 1 | show_interpro=1 | Show Interpro data for the given gene(s). |
| Pfam | show_pfam | 0, 1 | show_pfam=1 | Show Pfam data for the given gene(s). |
| Paralogs | show_paralogs | 0, 1 | show_paralogs=1 | Show paralogs for the given gene(s). |
Retrieving data with curl or wget
curl examplecurl -d 'genesymbol=APP,APOE,SHOX&json=1' https://www.genecascade.org/gd-cgi/results.cgiwget example
wget "https://www.genecascade.org/gd-cgi/results.cgi?genesymbol=LBR,LMNA,FBN1&json=1" -O json.json
Retrieving data with Python
import json
import requests

def process_data(obj):
	text = json.dumps(obj, sort_keys=True, indent=4)
	pass # Process your data here

if __name__ == "__main__":
	parameters = {
	"genesymbol": "APP,APOE,SHOX",
	"json": 1
	}

	response = requests.get("https://www.genecascade.org/gd-cgi/results.cgi", params=parameters)
	process_data(response.json())
Download example.
Integration via AJAX
GenDaB can be used by your own website to include gene information in various ways. The example below demonstrates how to extract the gene description and chromosome, as well as the start and end position of a gene.
async function query() {
	var gene = document.forms[0].genesymbol.value;
	const response = await fetch('https://www.genecascade.org/gd-cgi/results.cgi?json=1&genesymbol=' + gene);
	const json = await response.json();
	if (json[0].error) {
		alert(json[0].title + "\n" + json[0].info[0]);
	} else {
		document.forms[0].description.value = json[0].description;
		document.forms[0].chromosome.value = json[0].chromosome;
		document.forms[0].start.value = json[0].start_pos;
		document.forms[0].end.value = json[0].end_pos;
	}
}
Test working example.
Integration via iFrames
GenDaB supports the integration of its search interface into other web applications via iFrames. This allows for the seamless inclusion of GenDaB into existing information systems. The following code snippet shows how to incorporate the GenDaB search interface into a web application:<iframe id="tutorial_frame" src="https://www.genecascade.org/gd-cgi/results.cgi?genesymbol=APOE,APP" style="position: fixed; top: 0px; bottom: 0px; right: 0px; width: 100%; border: none; margin: 0; padding: 0; overflow: hidden; z-index: 999999; height: 100%;"> </iframe>Test working example.
API examples
Below we provide a few simple examples on how to use the GenDaB API for different search goals. Clicking the example links will lead you directly to the result in either JSON or HTML format. For further information on the parameters and how to use them, please refer to the API parameters section.
Example 1
Filter for the keyword "muscular" in OMIM reports for the genes LBR, LMNA and FBN1.API parameters: genesymbol=LBR,LMNA,FBN1 - keywords=muscular - show_keywords=filter - show_omim=1
See example as JSON or HTML.
Example 2
Look for Myopathy (HPO) in genes ABL1 and ACACA. Also show OMIM and Orphanet for the results.
API parameters: genesymbol=ABL1,ACACA - phenotype=HP:3198 - show_hpo=1 - show_orphanet=1 - show_omim=1
See example as JSON or
HTML.
Example 3
Filter the genes SOS1 and LMNA for the WikiPathways term "Regulation of actin cytoskeleton".
API parameters: genesymbol=SOS1,LMNA - molecularfunction=WikiPathways:51 - show_wikipathways=filter
See example as JSON or
HTML.
Frequently Asked Questions
How do I use the hide, show and filter buttons?
These radio buttons can be used to hide or display certain data in the output as well as use them to filter the results. By default, they will be set to either hide or show. When input is detected in a specific section, the corresponding radio button will automatically switch to filter.
As the names suggest, the hide and show option decide whether a specific section in the output is shown for each gene. For example setting the Interaction section to show will show all interactions for each gene that we have in our database, whereas setting it to hide will cause the output to not display any interaction data at all.
However, setting a section to filter will require user input to work, since it will filter the entire output accordingly. E.g. if you filter for interactions with the gene product of TP53, the output will only show you genes, who’s corresponding proteins interact with p53.
Which data is displayed by default in the results?
Most of the available data will be shown by default, the only sections that currently have to be set to show to be displayed are the following: interactions, expression, cellular localisation and the keyword search. For a comprehensive list of default settings, refer to the section overview in the Output documentation.
How can I use the API?
Our API is simple and free to use without registration. Simply use the result hyperlink (https://genecascade.org/gd-cgi/results.cgi?) with json=1 and any other parameters relevant to your query. For examples and query parameters, please refer to the API documentation.
Why are some sections not listed in the Display Options (e.g. HPO and Orphanet)?
Since some sections can be used as filters in addition to being shown, they can be managed with the hide, show, filter radio button described in the FAQ above.
What does OMIM gene info mean?
While the OMIM section shows reports on various phenotypes related to the queried gene, the OMIM gene info section shows the gene specific OMIM report on the actual gene.
I set a spsection to show, why does the output not display any data for it?
Most likely there is no data available in our database for this specific category for the genes in your query. The show does not filter out genes for which we have no data for your section of interest. To show only those genes, you may want use the filter setting.
Please note, that this works slightly different for the expression category (see next FAQ).
I filtered for expression, but the output shows me genes which don't seem to have any expression data for my selection, why?
The expression filter works a bit different than the rest of the GenDaB filters. GenDaB filters out only those genes which, according to our data, are explicitly not expressed in a certain tissues. Genes for which there is no data indicating that they are expressed or not expressed in the selected tissues, will still be included in the output.
If you have any additional questions, please refer to the GenDaB documentation or contact dominik.seelow AT bih-charite.de.
GenDaB - Legal
Contact
In case you discover bugs, have suggestions or questions, please write an e-mail to Dominik Seelow (dominik.seelow (at) bih-charite.de).We also appreciate hearing about your general experiences using the database.