
|
Mutation T@sterstatistics |
models
MutationTaster2 still uses 3 different models, one for alterations that do not cause any amino acid ( without_aee), one for simple substitutions ( simple_aae), and one for those changes that cause more complex changes in the aa sequence of the resulting peptide, such as a frameshift or a shifted start ATG ( complex_aae).training sets
The following table shows the composition of the data sets used to train the classifier. We used all available alterations that fulfilled our criteria (status 'disease mutation' in HGMD Pro or polymorphism confirmed by at least 4 carriers of this genotype in the 1000 Genomes Project (TGP) - variants that appeared in both groups were discarded). For the web-version, the classifier was trained with all alterations suitable for the given model; alterations of the less frequent type were fed several times into the training to reach equal frequencies of disease mutations and polymorphisms. See below for the composition of the cross-validation data sets.| model | n (polymorphisms) | n (disease mutations) | comments |
| without_aae | 6807269 | 122238 | each disease mutation was used 55 times in the training of the web version (56 times in the cross-validation) |
| simple_aae | 20967 | 151542 | each polymorphism was used 7 times in the training of the web version and in the cross-validation |
| complex_aae | 2340 | 123213 | each polymorphism was used 52 times in the training of the web version (57 times in the cross-validation) |
results of the cross-validation
| model | n | accuracy | accuracy (disease mutations) |
accuracy (polymorphisms) |
sensitivity | specificity | NPV | PPV |
| simple_aae | 4000 | 0.886 | 0.895 | 0.877 | 0.879 | 0.893 | 0.877 | 0.895 |
| ± | 0.004 | 0.005 | 0.008 | 0.007 | 0.004 | 0.008 | 0.005 | |
| without_aae | 4000 | 0.922 | 0.888 | 0.957 | 0.954 | 0.895 | 0.957 | 0.888 |
| ± | 0.004 | 0.006 | 0.004 | 0.004 | 0.005 | 0.003 | 0.006 | |
| complex_aae | 400 | 0.907 | 0.944 | 0.869 | 0.879 | 0.939 | 0.869 | 0.944 |
| ± | 0.017 | 0.004 | 0.032 | 0.026 | 0.005 | 0.032 | 0.004 |
| 1 | 1800 known disease mutations from HGMD Pro (disease state = DM [disease mutation]) |
| 1800 harmless polymorphisms from the 1000 genomes project (each of the 3 possible genotypes found in at least 50 samples)* | |
| 2 | 1800 known disease mutations from ClinVar (disease state = pathogenic) [not with MutationTaster1] |
| 1800 harmless polymorphisms from the 1000 genomes project (each of the 3 possible genotypes found in at least 50 samples) [not with MutationTaster1]* |
We submitted these alterations to the web interfaces of PolyPhen-2 (HumVar and HumDiv), SIFT, PROVEAN, MutationTaster2, and MutationTaster1 by entering the DNA change via the chromosomal position. Since these variants (on DNA level) might cause different substitutions in different transcripts, we extracted the one result corresponding to the amino acid exchange from the testset. If there were several results for the amino acid exchange in question, we used the first result. Since some variants could not be analysed by all programs (or at least did not return the required amino acid substitution), we randomly selected 1300(ClinVar)/1100(HGMD) disease mutations and 1300(ClinVar)/1100(HGMD) polymorphisms out of the 2381 (HGMD) or 2814 (ClinVar) variants for which all programs gave predictions. We then compared the predictions for these 2600/2200 test cases.
results of the cross-comparison
| programme | total | TP | TN | FP | FN | NPV | PPV | sensitivity | specificity | accuracy |
| 1000 genomes and HGMD Pro | ||||||||||
| PPH2-var | 2200 | 868 | 976 | 124 | 232 | 80.8% | 87.5% | 78.9% | 88.7% | 83.8% |
| PPH2-div | 2200 | 944 | 903 | 197 | 156 | 85.3% | 82.7% | 85.8% | 82.1% | 84.0% |
| PROVEAN | 2200 | 856 | 966 | 134 | 244 | 79.8% | 86.5% | 77.8% | 87.8% | 82.8% |
| SIFT | 2200 | 910 | 944 | 156 | 190 | 83.2% | 85.4% | 82.7% | 85.8% | 84.3% |
| MT1 | 2200 | 931 | 961 | 139 | 169 | 85.0% | 87.0% | 84.6% | 87.4% | 86.0% |
| MutationTaster2 | 2200 | 976 | 961 | 139 | 124 | 88.6% | 87.5% | 88.7% | 87.4% | 88.0% |
| 1000 genomes and ClinVar | ||||||||||
| PPH2-var | 2600 | 1108 | 1159 | 141 | 192 | 85.8% | 88.7% | 85.2% | 89.2% | 87.2% |
| PPH2-div | 2600 | 1175 | 1076 | 224 | 125 | 89.6% | 84.0% | 90.4% | 82.8% | 86.6% |
| PROVEAN | 2600 | 1096 | 1146 | 154 | 204 | 84.9% | 87.7% | 84.3% | 88.2% | 86.2% |
| SIFT | 2600 | 1136 | 1123 | 177 | 164 | 87.3% | 86.5% | 87.4% | 86.4% | 86.9% |
| MutationTaster2 | 2600 | 1213 | 1132 | 168 | 87 | 92.9% | 87.8% | 93.3% | 87.1% | 90.2% |
MutationTaster2 displays automatic predictions for known harmless polymorphisms from the 1000 Genomes Project and known disease mutations from NCBI ClinVar. For the comparison of MutationTaster2 with the other tools, we did not consider the automatically displayed prediction (which is per se correct - or at least the same as our prior) but the actual prediction made by the classifier, which is reflected by the probability-value. (An automatic prediction with a probability below 0.5 means that MutationTaster2 would predict the other case if it would not consider the known outcome of this variant.) The performance of MutationTaster on real life data, where known polymorphisms / disease mutations are recognised, is hence even better than the accuracy shown here. Please see our example using a real exome to evaluate the use of MutationTaster!
These results suggest a bias towards mutations with a more obvious
effect on the protein in ClinVar (as of February 2013) because all
programs perform better on the ClinVar data set. See the ClinVar set and the single results.
For copyright reasons, we are unable to reproduce the list of disease mutations
obtained from HGMD Professional as text,
but we can offer the predictions for the disease mutations
and polymorphisms as images. We also provide the results
as a comprehensive text file, but here the identities of the HGMD disease mutations are replaced
by sequential numbers.
We also provide detailed
statistics about the consensus among the different tools for the HGMD
data set.
ROC plot
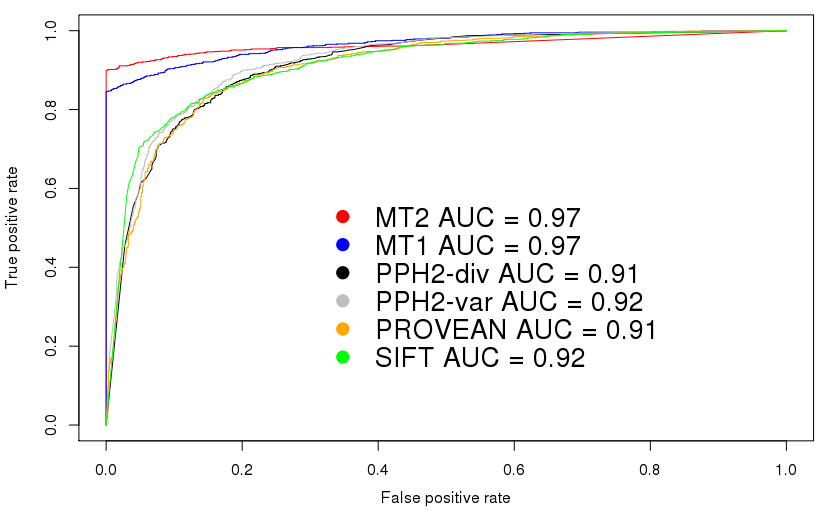
This plot shows the receiver operating characteristics for the
comparison using the HGMD/TGP dataset. Please note that these plots
are intended to set a threshold to discriminate signals from noise -
or, in case of score-based predictiors, to find an optimal cut-off
value between disease mutations and polymorphisms.
MutationTaster2 does not return a 'score' but only a boolean
prediction (disease causing or not) plus a confidence score for this
prediction. This kind of plot is hence not very useful to determine
the performance of MutationTaster2 (it would indeed be very useful to
determine cut-off values for continuous values, e.g. for predictions
only based on PhyloP or PhastCons).
We know, however, that in
many articles ROC curves are used to compare tools such as
MutationTaster2 and hence include these curves to show that
MutationTaster2 has, as its predecessor, a higher area under curve
(AUC).
|
Non-synonymous, synonymous, and non-coding variants
|
only variants leading to single amino acid substitutions
|
|||||||||||||||||||||||||||||||||||||||||||||||||||||||||||||||||||||||||||||||||||||||||||
data
MutationTaster's results can be interactively inspected: vcf_7890_1559988265/progress.html.